Open Access
Fig. 9.
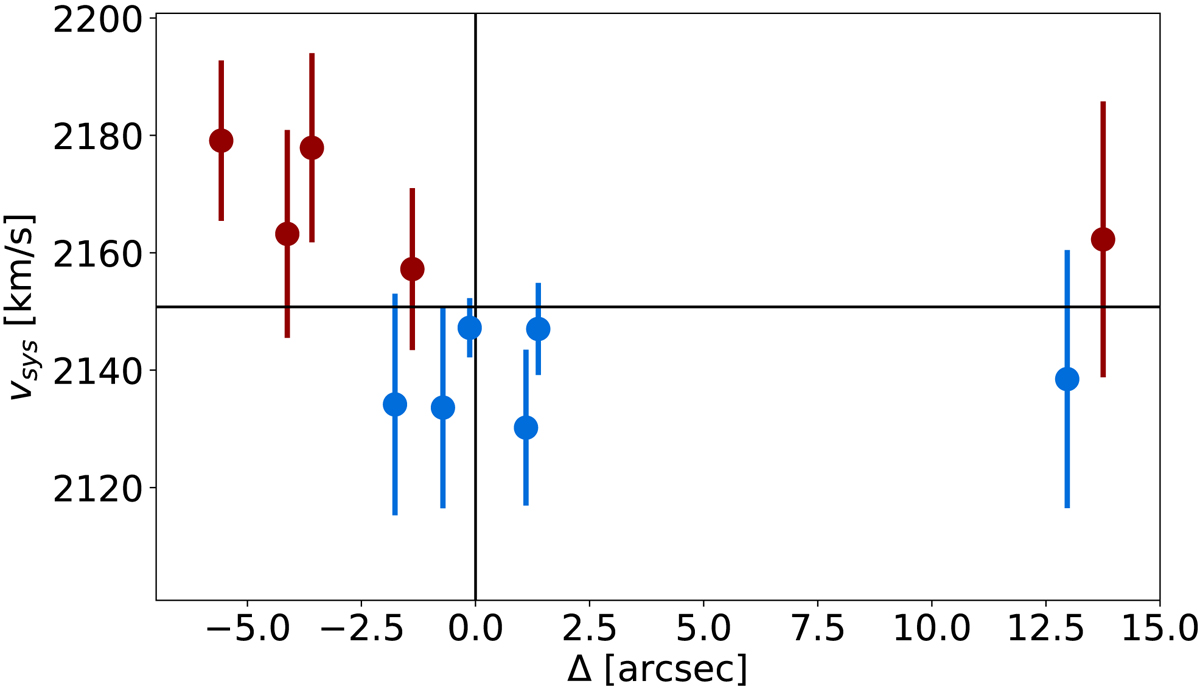
Position-velocity diagram for the GC system, using the 2D distance to the best-fit rotation axis with angle θ. Red and blue indicates whether the GCs are red or blueshifted with respect to the velocity of the GC system.
Current usage metrics show cumulative count of Article Views (full-text article views including HTML views, PDF and ePub downloads, according to the available data) and Abstracts Views on Vision4Press platform.
Data correspond to usage on the plateform after 2015. The current usage metrics is available 48-96 hours after online publication and is updated daily on week days.
Initial download of the metrics may take a while.