Fig. 7.
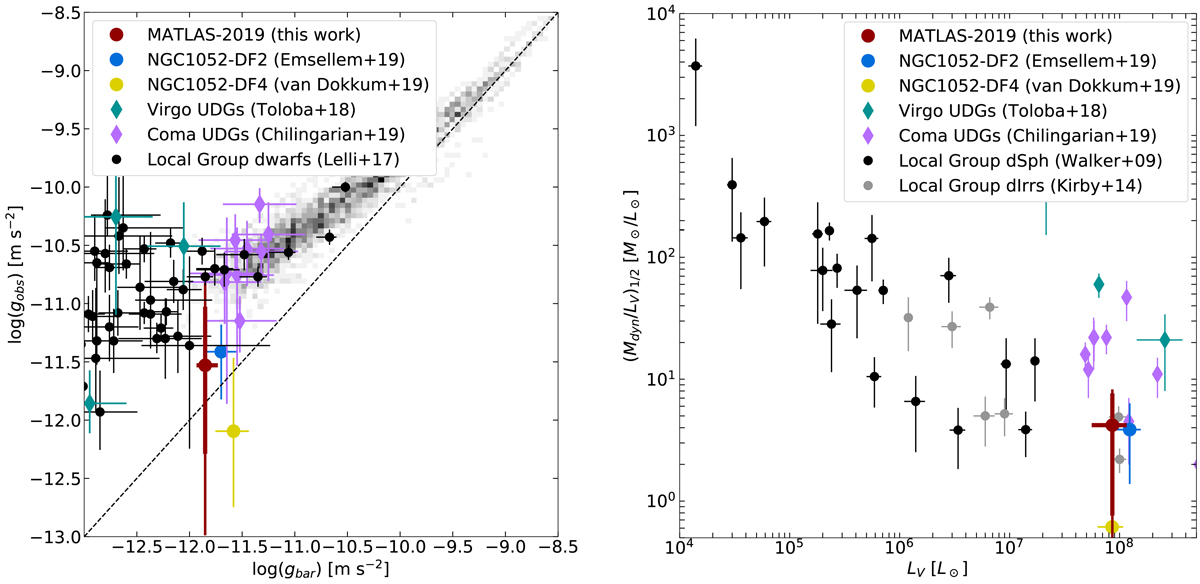
Left: radial acceleration relation (RAR) by Lelli et al. (2017). The black dots correspond to the Local Group dwarfs compiled in Lelli et al. (2017). The red dot plus lines give the measured values for MATLAS-2019 and its uncertainties (1 and 2σ), respectively. The blue dot is the UDG NGC 1052-DF2 observed with MUSE (Emsellem et al. 2019), and the yellow dot is NGC 1052-DF4 (van Dokkum et al. 2019). The cyan and violet squares are UDGs in the Virgo cluster (Toloba et al. 2018) and the Coma cluster (Chilingarian et al. 2019), respectively. The dashed line corresponds to unity. Right: mass-to-light ratios for Local Group dwarf dSph (black dots, Walker et al. 2009) and dIrr (gray dots, Kirby et al. 2014), MATLAS-2019 (red dot), NGC 1052-DF2 (blue dot, Emsellem et al. 2019), NGC 1052-DF4 (yellow dot, van Dokkum et al. 2019), and the UDGs in the Virgo cluster (cyan diamonds, Toloba et al. 2018) and the Coma cluster (violet diamonds, Chilingarian et al. 2019) as a function of their luminosities.
Current usage metrics show cumulative count of Article Views (full-text article views including HTML views, PDF and ePub downloads, according to the available data) and Abstracts Views on Vision4Press platform.
Data correspond to usage on the plateform after 2015. The current usage metrics is available 48-96 hours after online publication and is updated daily on week days.
Initial download of the metrics may take a while.