Open Access
Fig. 3.
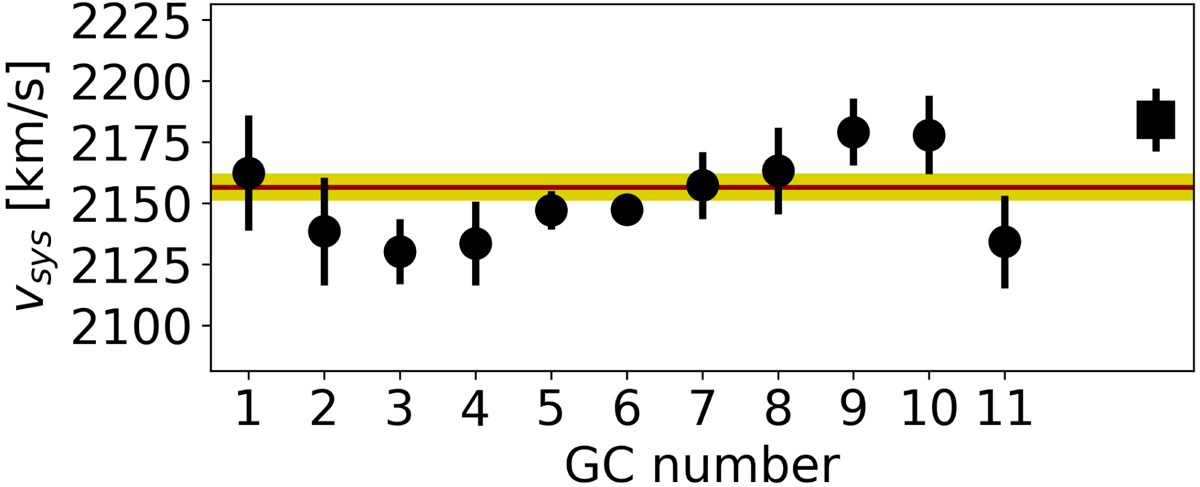
Velocities derived from the dominant absorption lines. The dots correspond to the velocities of the GCs, the square corresponds to the stacked spectra of the two remaining MATLAS GC candidates. The red line and shaded region indicate the velocity of the stellar body of the UDG and the corresponding uncertainty.
Current usage metrics show cumulative count of Article Views (full-text article views including HTML views, PDF and ePub downloads, according to the available data) and Abstracts Views on Vision4Press platform.
Data correspond to usage on the plateform after 2015. The current usage metrics is available 48-96 hours after online publication and is updated daily on week days.
Initial download of the metrics may take a while.