Fig. 1.
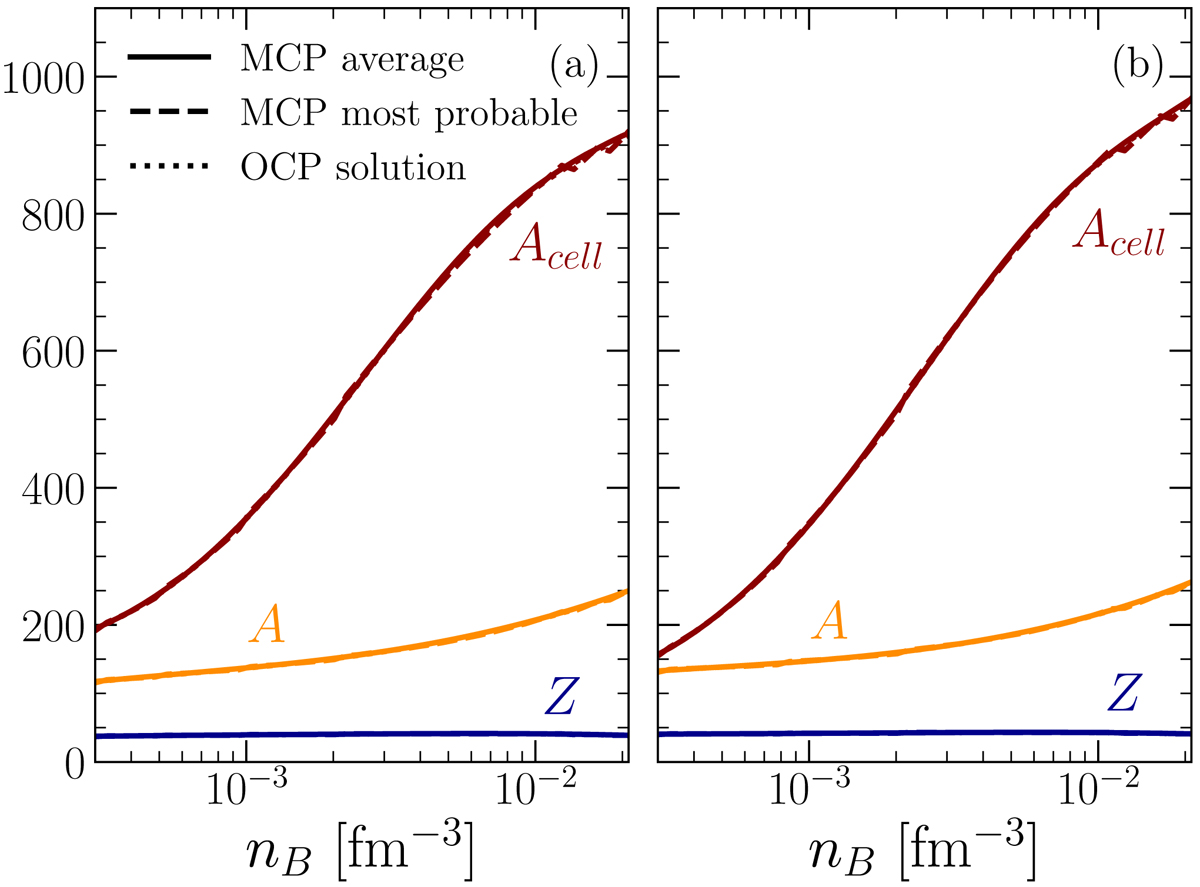
Variation with baryon density nB of the average (solid lines) and most probable (dashed lines) values of the charge number Z (blue lines), cluster mass number A (orange lines), and total mass number Acell (red lines) in the inner crust at two selected temperatures: T = 1010 K (panel a), and T = Tm (panel b). Results obtained in the one-component plasma (OCP) approximation are also shown (dotted lines).
Current usage metrics show cumulative count of Article Views (full-text article views including HTML views, PDF and ePub downloads, according to the available data) and Abstracts Views on Vision4Press platform.
Data correspond to usage on the plateform after 2015. The current usage metrics is available 48-96 hours after online publication and is updated daily on week days.
Initial download of the metrics may take a while.