Fig. 2.
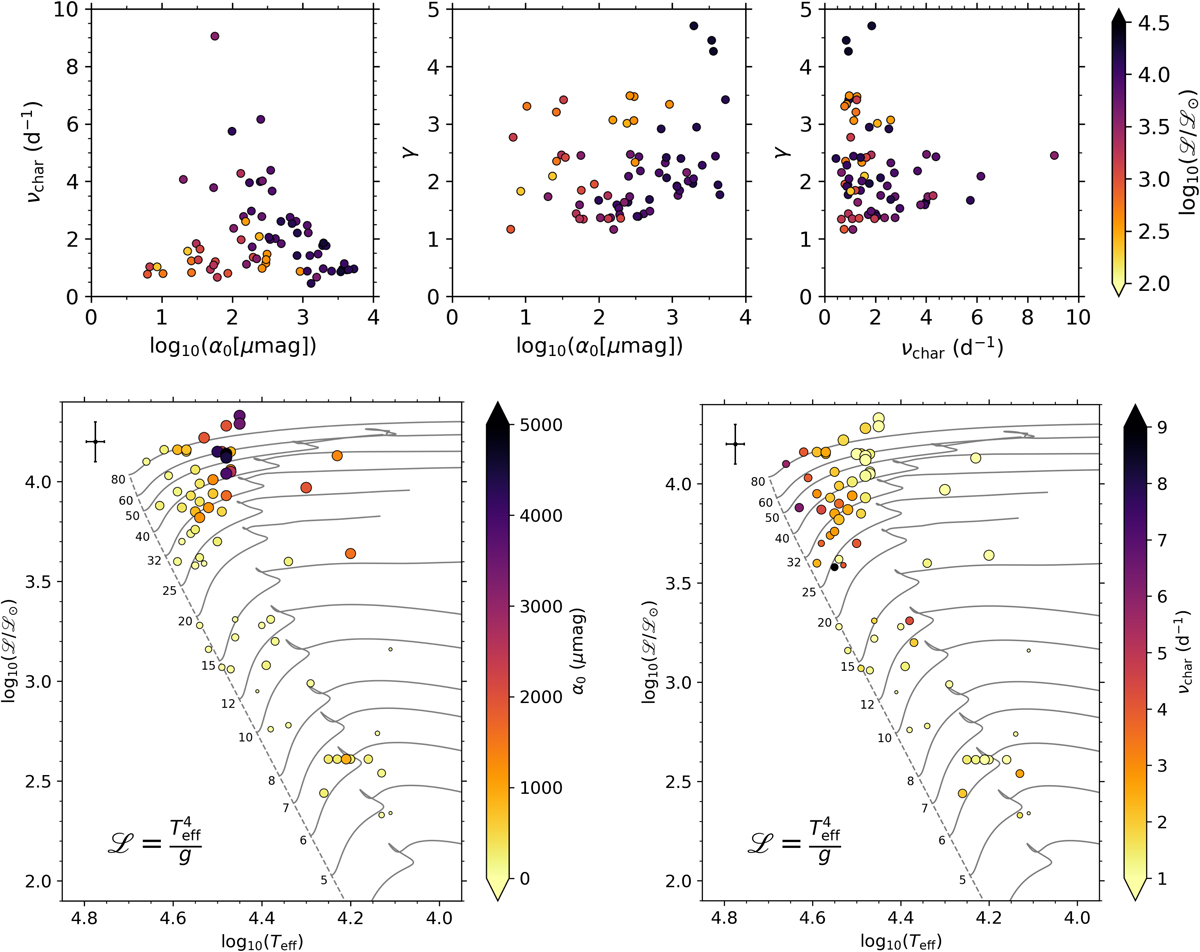
Top row: pairwise relationship between α0, νchar and γ (cf. Eq. (2)) best-fit parameters for our sample of OB stars. Bottom row: location of stars in the spectroscopic HR diagram as filled circles that are colour-coded by the best-fit parameters α0 (left) and νchar (right), and have a symbol size proportional to the fit parameter α0. Evolutionary tracks (in units of M⊙) from Burssens et al. (2020) are shown as solid grey lines and the dashed grey line represents the ZAMS. A typical spectroscopic error bar for our sample is shown in the top-left corner.
Current usage metrics show cumulative count of Article Views (full-text article views including HTML views, PDF and ePub downloads, according to the available data) and Abstracts Views on Vision4Press platform.
Data correspond to usage on the plateform after 2015. The current usage metrics is available 48-96 hours after online publication and is updated daily on week days.
Initial download of the metrics may take a while.