Fig. 1.
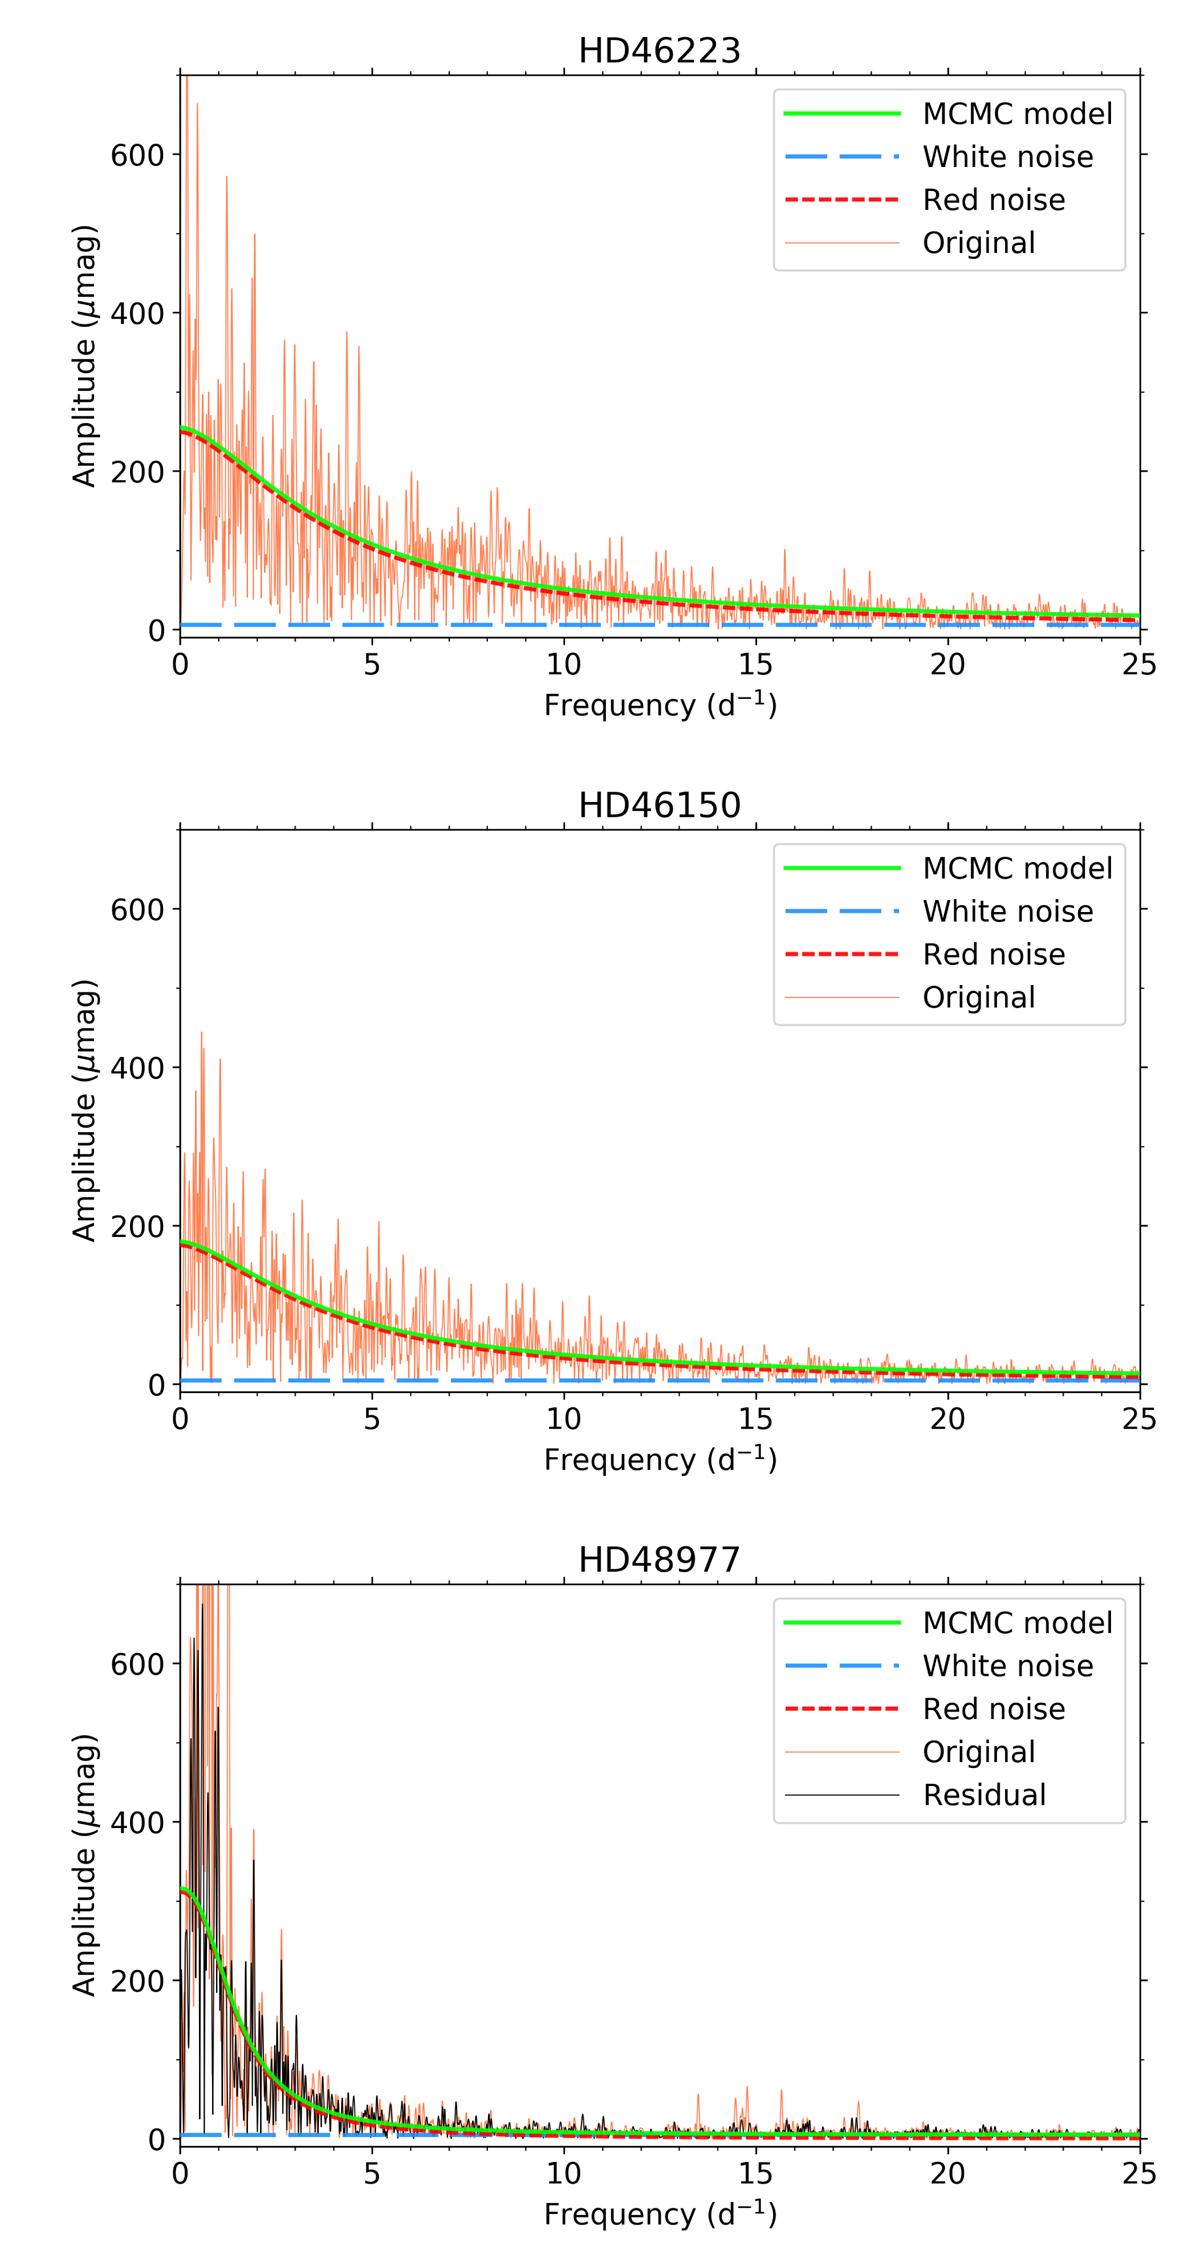
Fitted amplitude spectra calculated using TESS light curves for the O4 V((f)) star HD 46223 (top panel), the O5 V((f)) star HD 46150 (middle panel), the B2.5 V star HD 48977 (bottom panel), which were previously observed by the CoRoT mission and concluded to exhibit IGWs (Bowman et al. 2019b). We note that of these three examples, only HD 48977 underwent iterative pre-whitening to produce a residual amplitude spectrum because it exhibits significant p-mode frequencies above 10 d−1.
Current usage metrics show cumulative count of Article Views (full-text article views including HTML views, PDF and ePub downloads, according to the available data) and Abstracts Views on Vision4Press platform.
Data correspond to usage on the plateform after 2015. The current usage metrics is available 48-96 hours after online publication and is updated daily on week days.
Initial download of the metrics may take a while.