Fig. 5.
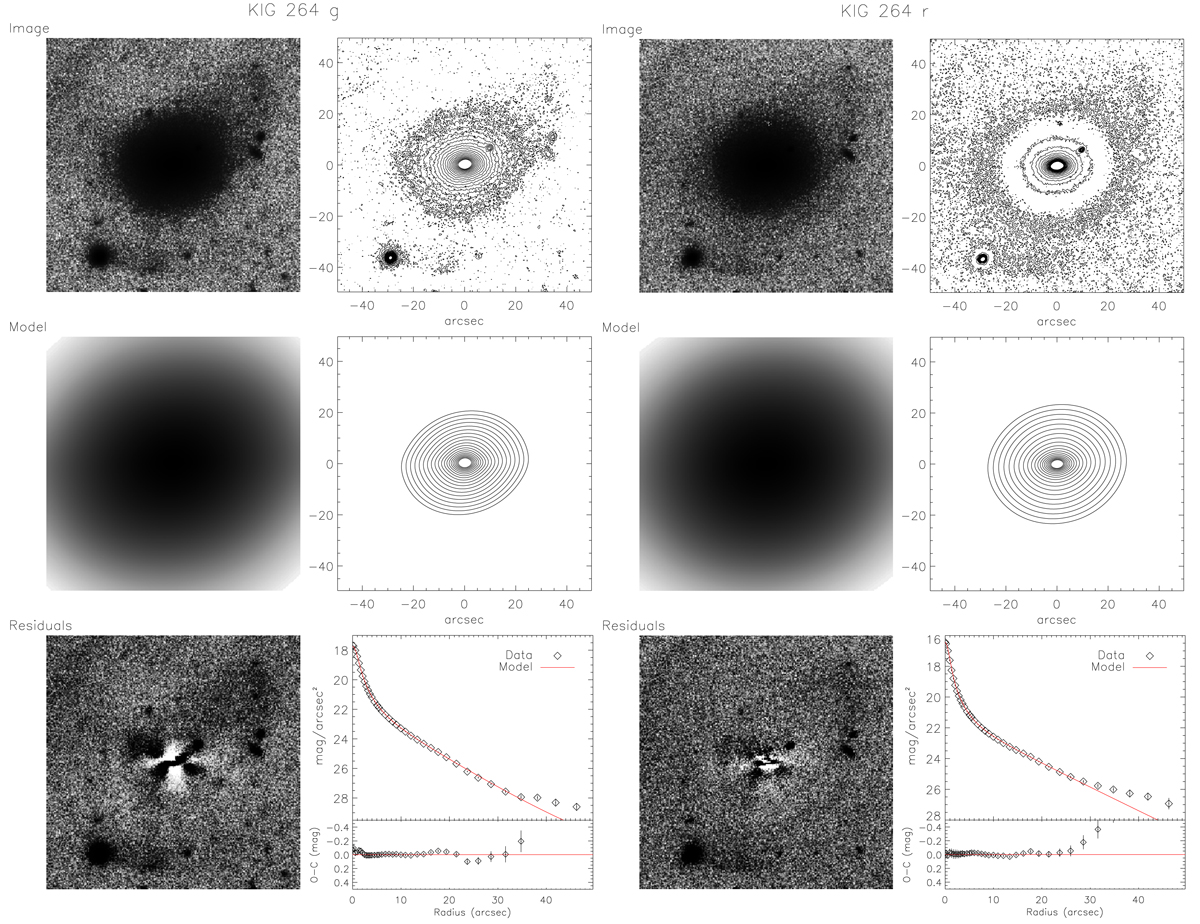
Summary of the g− (left panels) and r− (right panels) band surface photometry of KIG 264. The adopted masks of the foreground and background objects are not shown. North is up, and east is to the left. The right panels provide from top to bottom (left) the original image, the best-fit model image, and the image of residuals after model subtraction for the g band. (right) Isophotal contours of the image, of the model, and of the azimuthal light profile. For clarity, only the model (red line) is over-plotted on the azimuthal light profile, and the (O–C) residuals are shown. Table 4 reports the model parameters. We show 20 isophote levels, between 500 and 2 σ of the sky level (μg = 21.6 ± 0.02 and 26.9 ± 0.34 mag arcsec−2 and μr = 21.0 ± 0.02 and 26.6 ± 0.29 mag arcsec−2), for the original and model images. The same panels are shown for the r-band photometry. KIG 264 reveals ripples and tail at the NW side of the galaxy body and a shell system in the outskirts. These features are revealed in both the g and r images above 2σ of the sky level and in the light profiles, starting at ≈30″.
Current usage metrics show cumulative count of Article Views (full-text article views including HTML views, PDF and ePub downloads, according to the available data) and Abstracts Views on Vision4Press platform.
Data correspond to usage on the plateform after 2015. The current usage metrics is available 48-96 hours after online publication and is updated daily on week days.
Initial download of the metrics may take a while.