Free Access
Fig. 3.
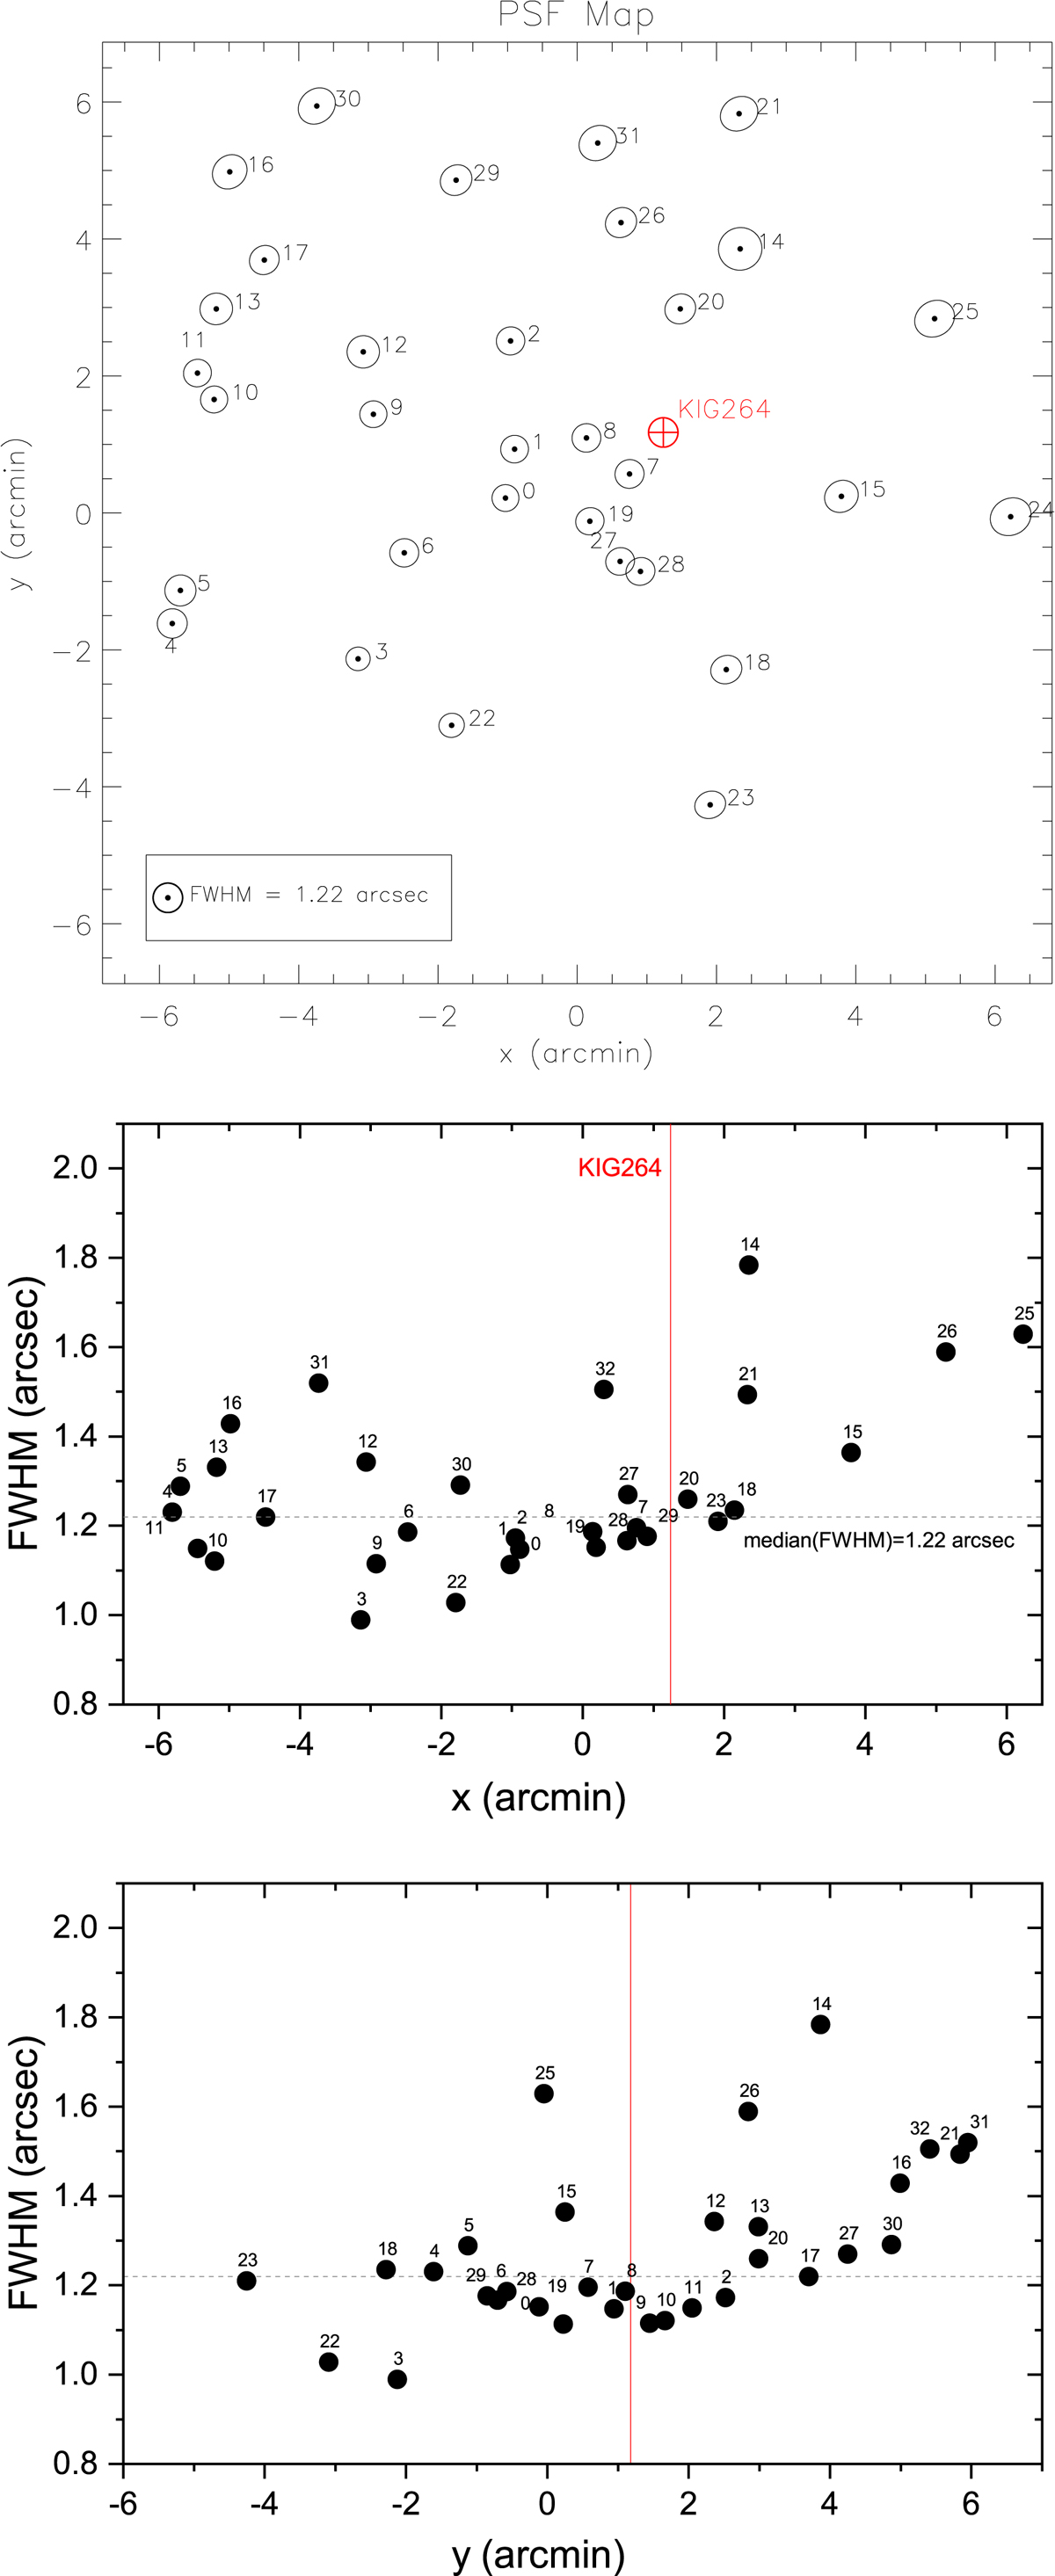
Top panel: 2D map of the PSF FWHM variation across the g -band FOV of KIG 264. Middle panel: FWHM measured along the x-axis (RA) and along the y-axis (Decl., bottom panel) of this frame. The vertical red line marks the position of KIG 264.
Current usage metrics show cumulative count of Article Views (full-text article views including HTML views, PDF and ePub downloads, according to the available data) and Abstracts Views on Vision4Press platform.
Data correspond to usage on the plateform after 2015. The current usage metrics is available 48-96 hours after online publication and is updated daily on week days.
Initial download of the metrics may take a while.