Fig. A.9.
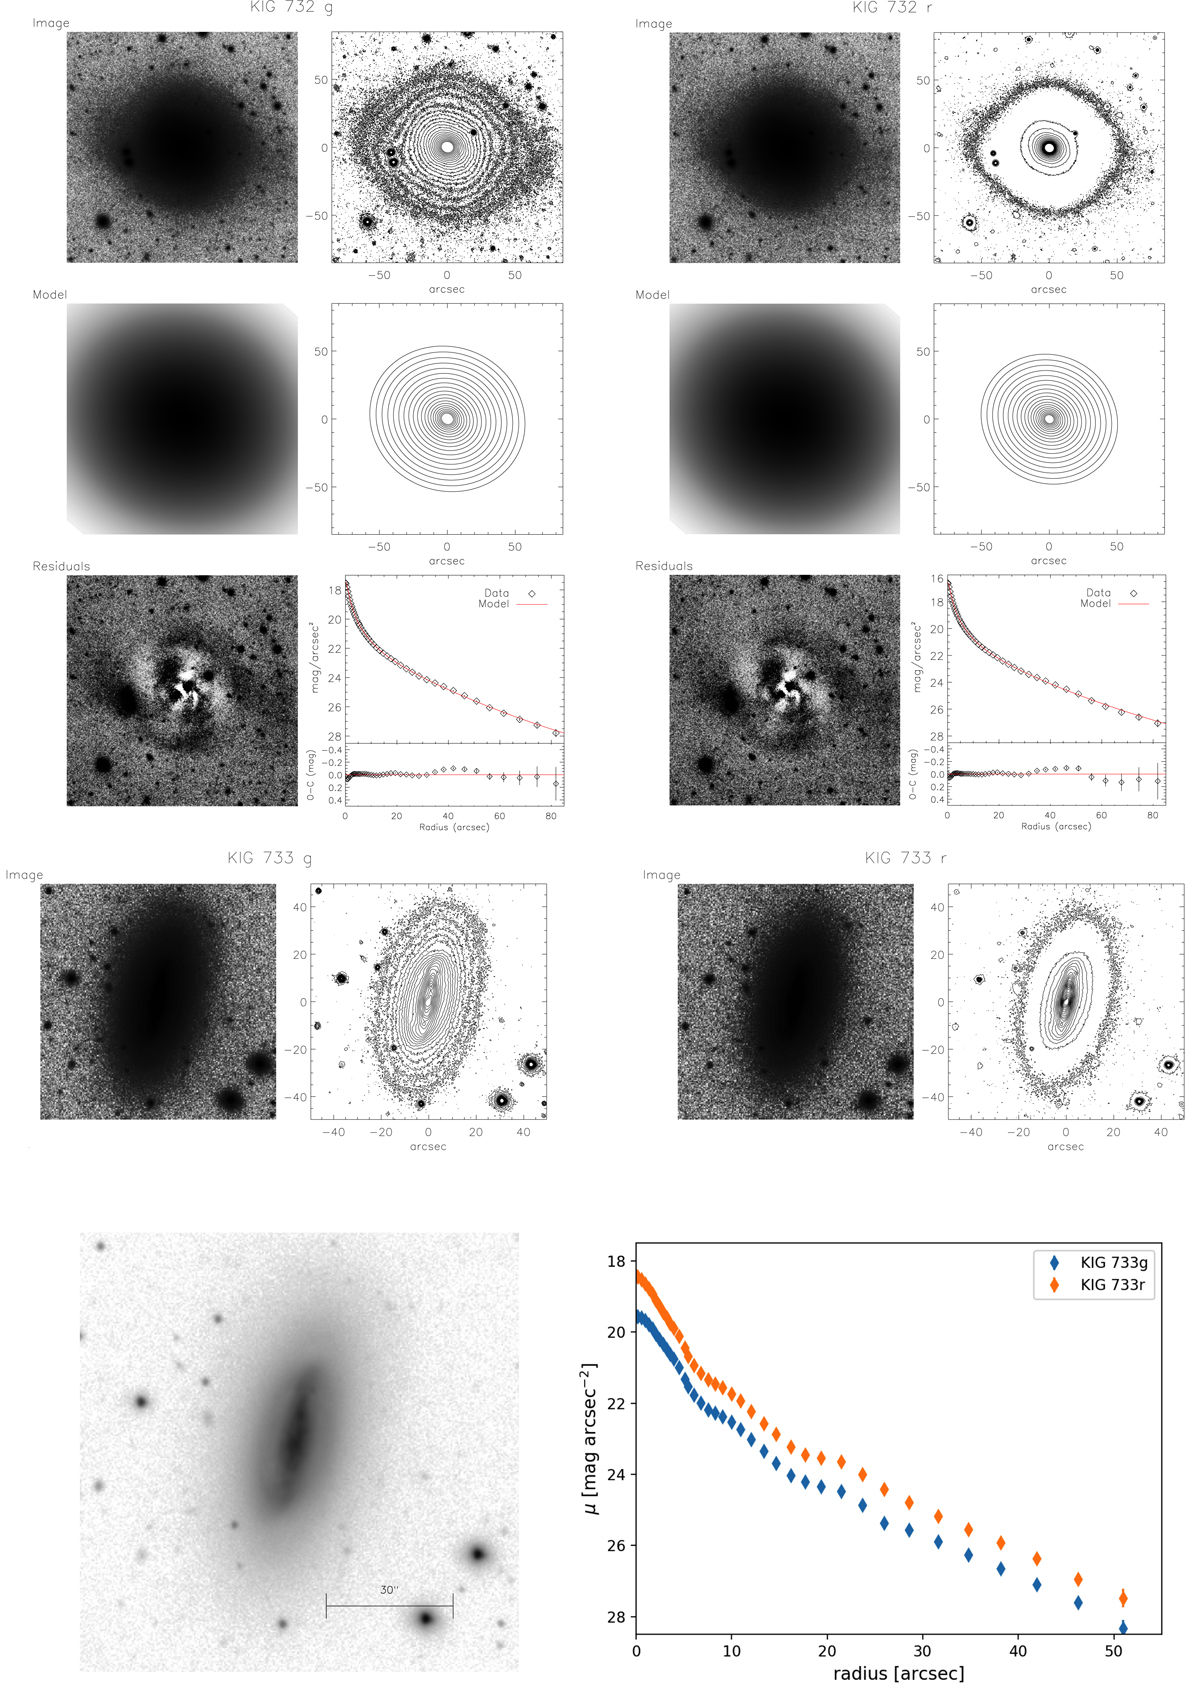
As in Fig. 5. Summary of the surface photometric analysis of KIG 732 (top panels). We show the B+D model. We show 20 isophote levels, between 500 and 2σ of the sky level, for the original and model images. Summary of the surface photometric analysis of KIG 733 (middle panels). Deep g and r images are shown with isophote contours down to the 2σ level of the sky. Bottom panels: the right r image enhances the central part of KIG 733, showing the ring and the arm-like structure, and the left panel shows the g and r light profiles.
Current usage metrics show cumulative count of Article Views (full-text article views including HTML views, PDF and ePub downloads, according to the available data) and Abstracts Views on Vision4Press platform.
Data correspond to usage on the plateform after 2015. The current usage metrics is available 48-96 hours after online publication and is updated daily on week days.
Initial download of the metrics may take a while.