Fig. A.6.
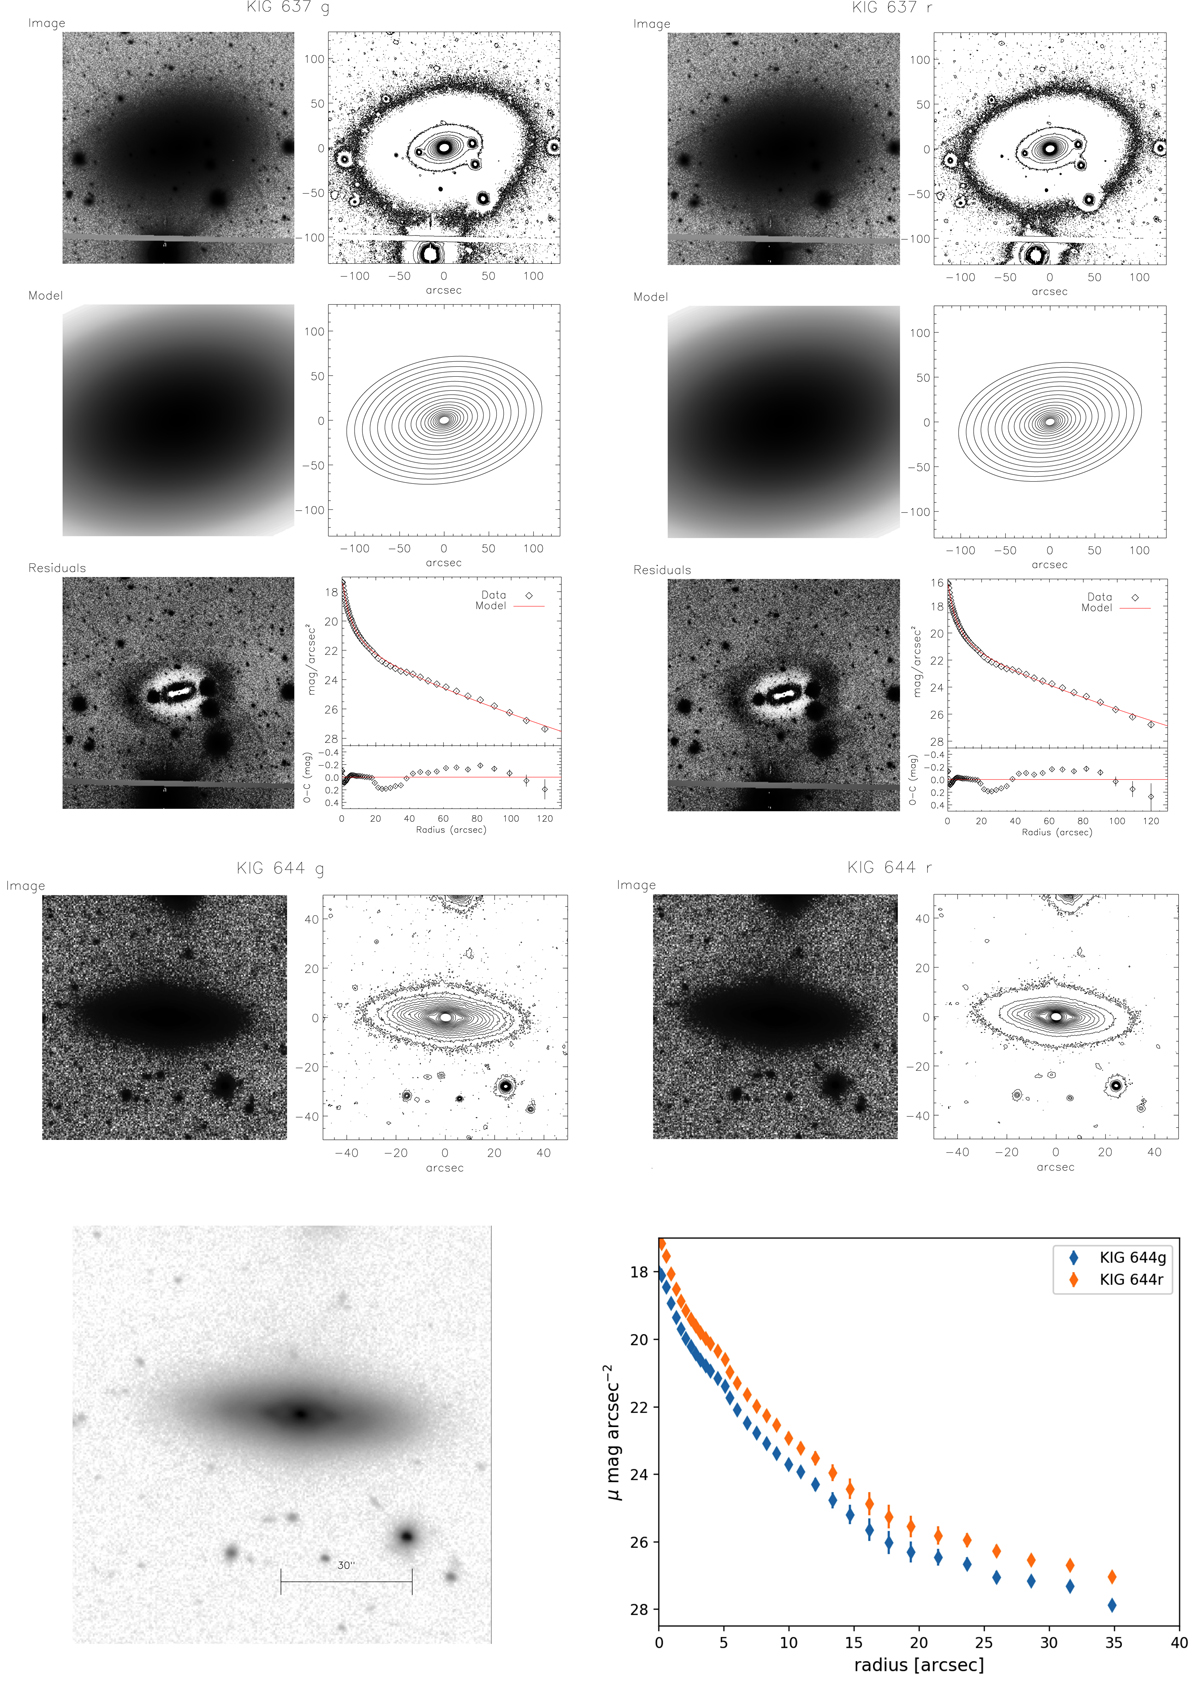
As in Fig. 5. Summary of the surface photometric analysis of KIG 637 (top panels). In both bands we show the B+D models. The image of KIG 637 shows the gap in the 4K CCD. The corona of the bright star HD 238370, south of the galaxy nucleus, extends across the entire galaxy and strongly affects the photometric measures. We show 20 isophote levels, between 500 and 2σ of the sky level, for the original and model images. Summary of the surface photometric analysis of KIG 644 (middle and bottom panels). Deep g and r images are shown with isophote contours down to the 2σ level of the sky. The right r image enhances the central part of KIG 644, showing the ring and the lens structures; the left panel shows the g and r light profiles.
Current usage metrics show cumulative count of Article Views (full-text article views including HTML views, PDF and ePub downloads, according to the available data) and Abstracts Views on Vision4Press platform.
Data correspond to usage on the plateform after 2015. The current usage metrics is available 48-96 hours after online publication and is updated daily on week days.
Initial download of the metrics may take a while.