Fig. 7
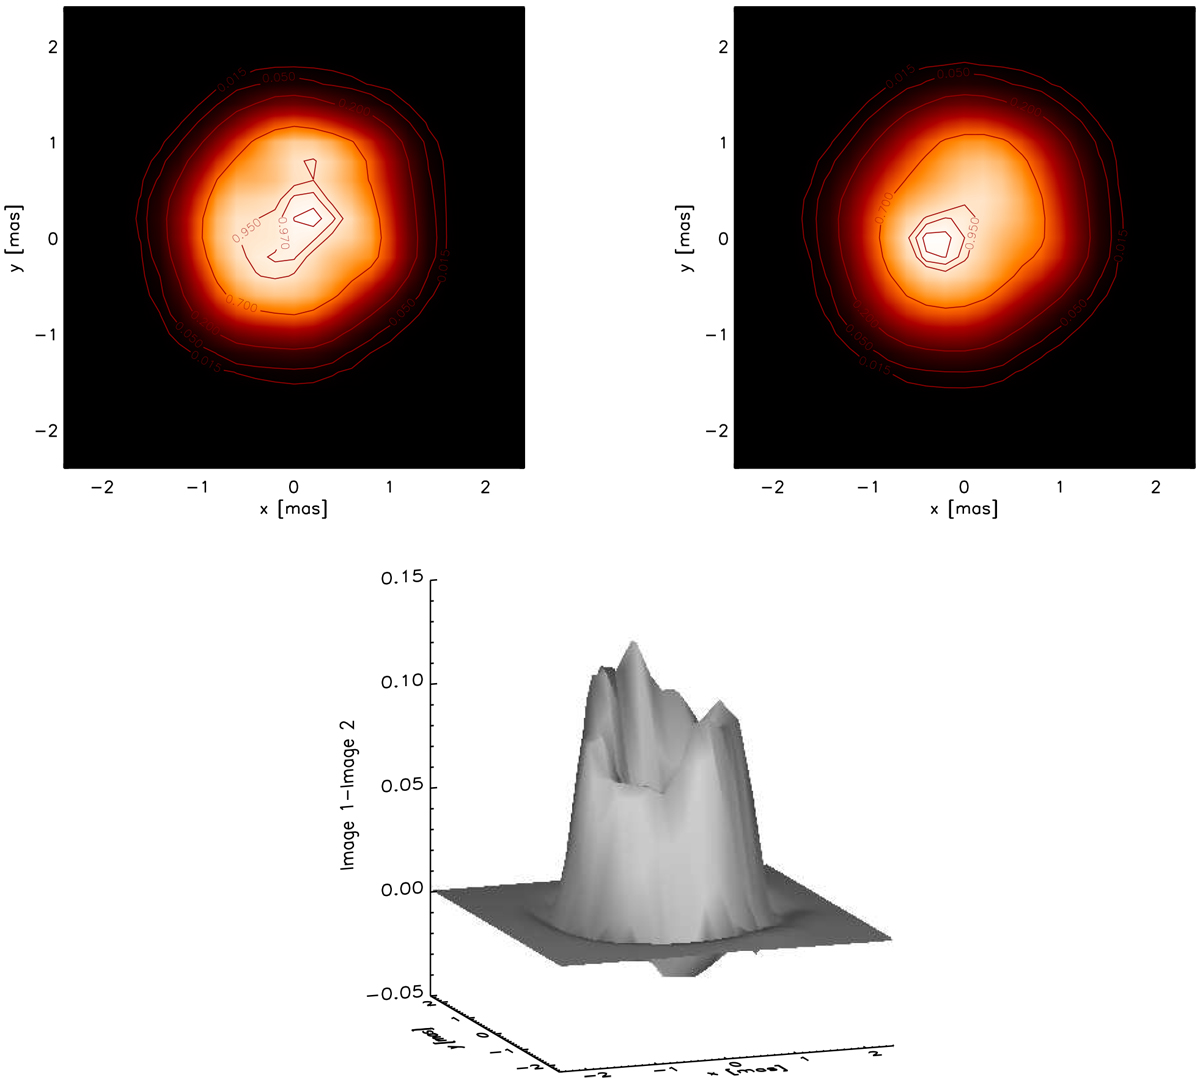
Top panels: synthetic intensity maps computed for the best matching RHD simulation of Table 3 at 1.52 (left) and 1.70 (rigth) μm. The intensity is normalised between [0, 1]. The images, 64 × 64 pixels with 0.2 mas pixel−1, were convolved with the interferometric beam (Fig. 1). The contour lines are thesame as in Fig. 2. East is left, while north is up. Bottom panel: surface rendering difference between the synthetic images at 1.52 and 1.70 μm (right).
Current usage metrics show cumulative count of Article Views (full-text article views including HTML views, PDF and ePub downloads, according to the available data) and Abstracts Views on Vision4Press platform.
Data correspond to usage on the plateform after 2015. The current usage metrics is available 48-96 hours after online publication and is updated daily on week days.
Initial download of the metrics may take a while.