Open Access
Fig. 6
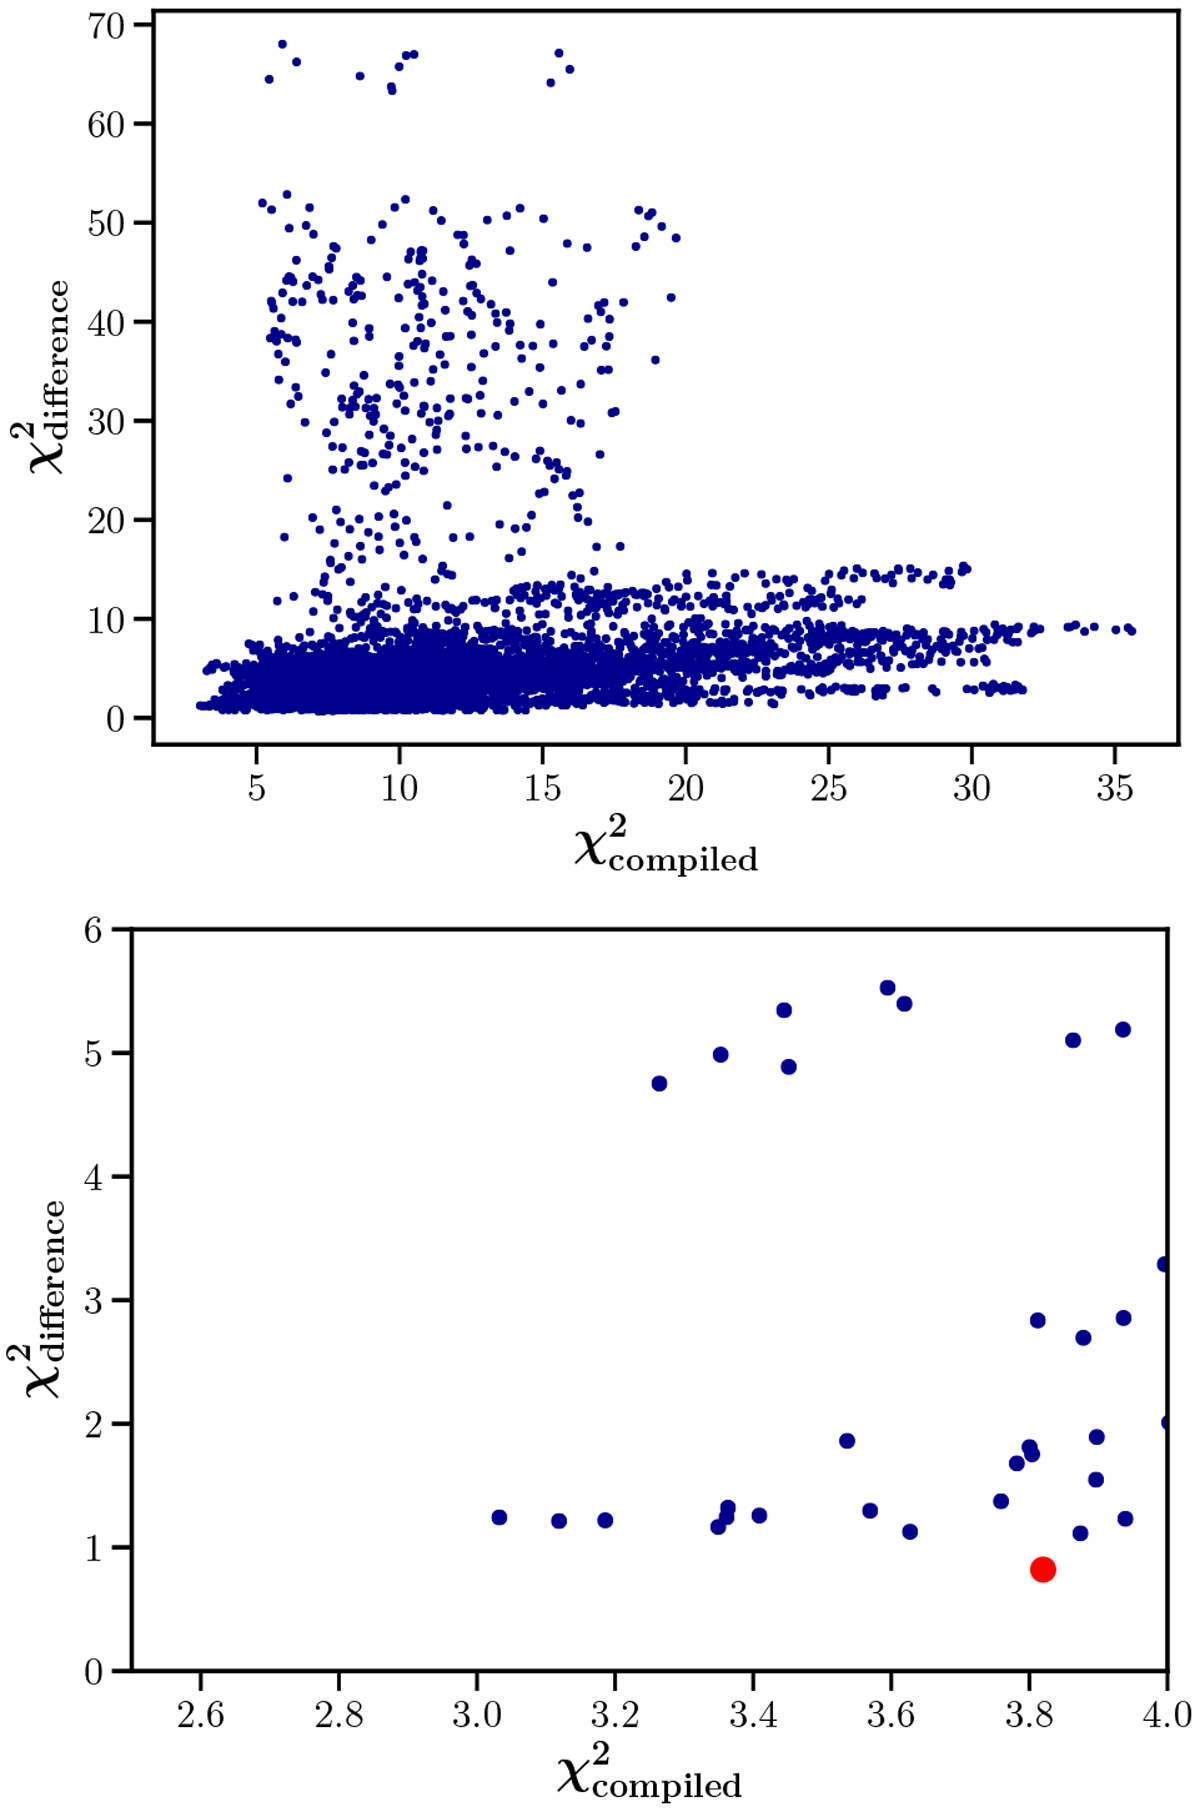
Top panel: compiled ![]() versus
versus ![]() (see text for details) for all the snapshots and rotation angles considered (blue points) for the comparison with the reconstructed images. Bottom panel: enlargement within the region where the best matching snapshot and rotation angle is chosen (large red point).
(see text for details) for all the snapshots and rotation angles considered (blue points) for the comparison with the reconstructed images. Bottom panel: enlargement within the region where the best matching snapshot and rotation angle is chosen (large red point).
Current usage metrics show cumulative count of Article Views (full-text article views including HTML views, PDF and ePub downloads, according to the available data) and Abstracts Views on Vision4Press platform.
Data correspond to usage on the plateform after 2015. The current usage metrics is available 48-96 hours after online publication and is updated daily on week days.
Initial download of the metrics may take a while.