Fig. 5
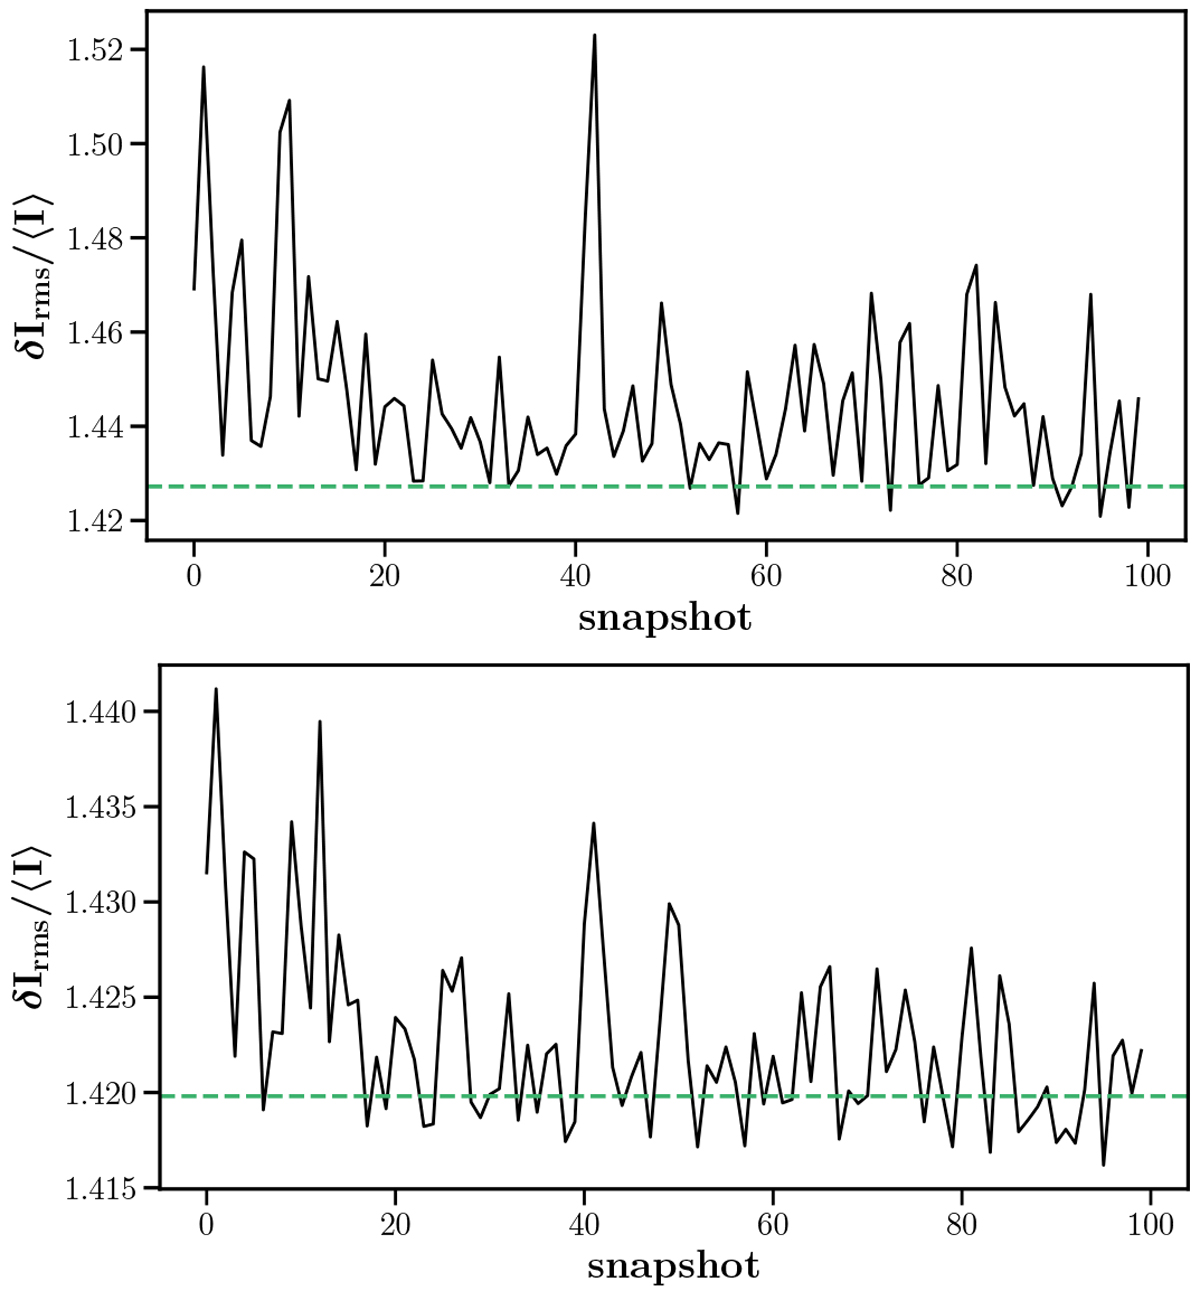
Fluctuations at 1.52 μm (top) and 1.70 μm (bottom) for all the snapshots of the RHD simulation of Table 3 after being corrected for limb-darkening and convolved with the interferometric beam. The horizontal dashed line displays the contrasts measured in the reconstructed images of Fig. 2: 1.424 at 1.52 μm and 1.423 at 1.70 μm.
Current usage metrics show cumulative count of Article Views (full-text article views including HTML views, PDF and ePub downloads, according to the available data) and Abstracts Views on Vision4Press platform.
Data correspond to usage on the plateform after 2015. The current usage metrics is available 48-96 hours after online publication and is updated daily on week days.
Initial download of the metrics may take a while.