Free Access
Fig. 9.
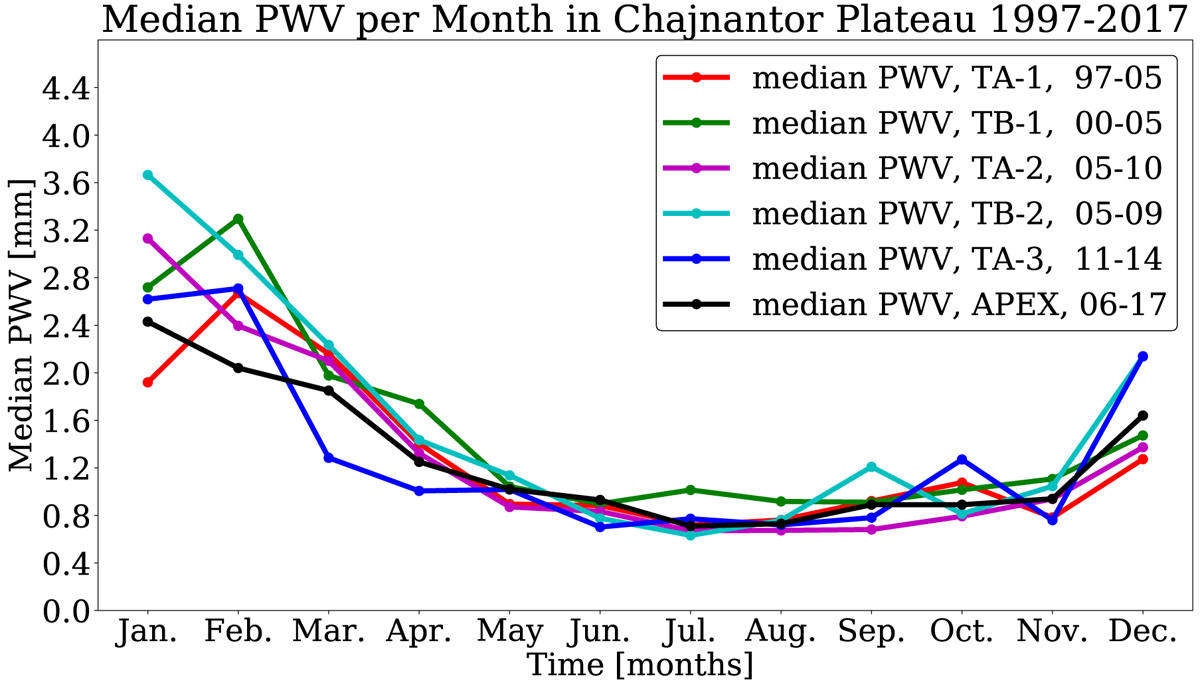
Median PWV per month per instrument located at the Chajnantor Plateau, over a 20-year span. The highest value and dispersion for the mean PWV in the months of January and February and the lower PWV in the months of June, July, and August are noted. This plot shows the consistency between the measurements of the instruments.
Current usage metrics show cumulative count of Article Views (full-text article views including HTML views, PDF and ePub downloads, according to the available data) and Abstracts Views on Vision4Press platform.
Data correspond to usage on the plateform after 2015. The current usage metrics is available 48-96 hours after online publication and is updated daily on week days.
Initial download of the metrics may take a while.