Fig. 3.
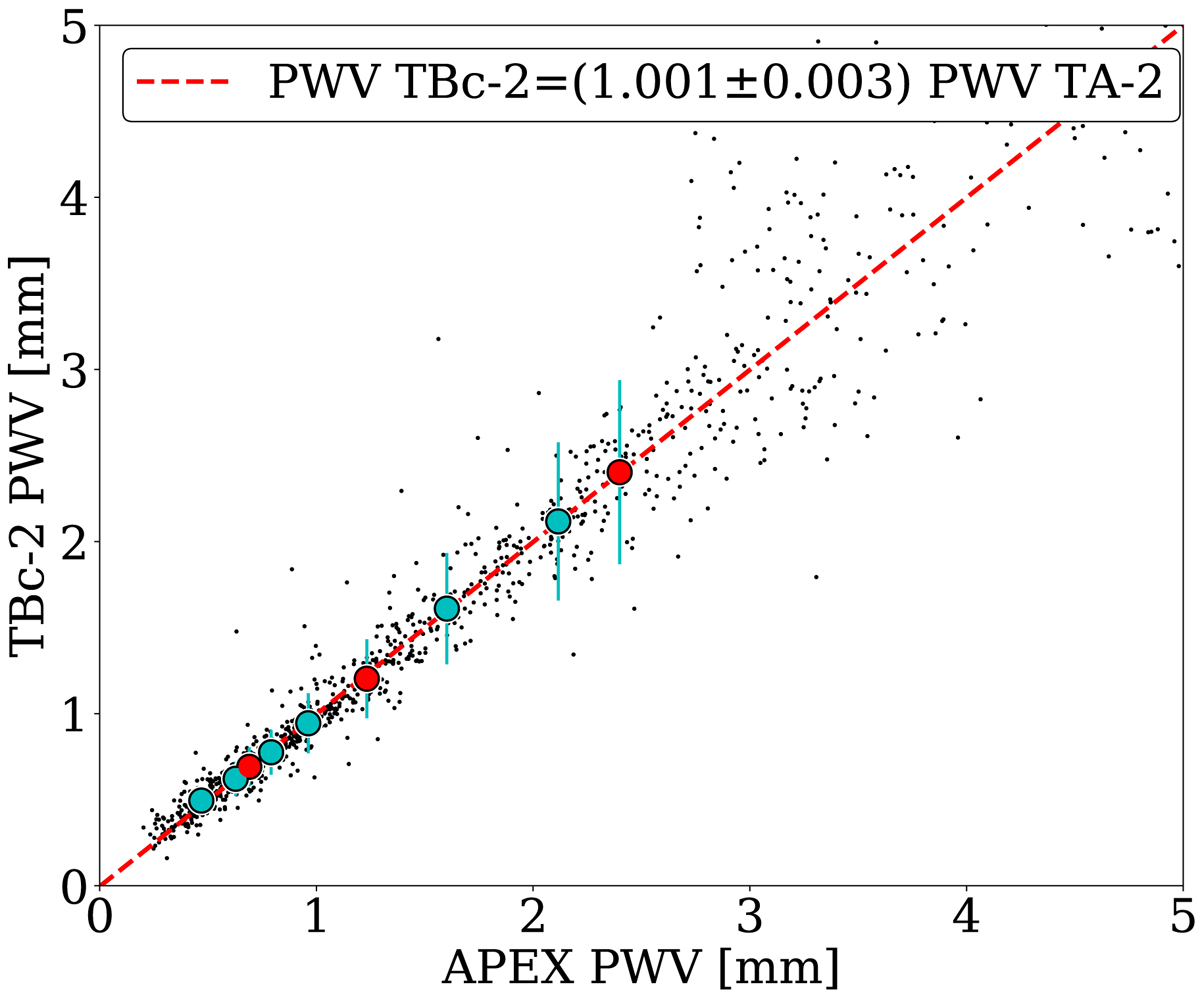
Corrected tipper data for a shared location measurement campaign, for tippers TA and TB, at the Chajnantor Plateau (CBI) site, covering years 2005 and 2006. The cyan circles are the PWV quantiles used in linear regression. The red circles indicate the quartiles (25%, 50%, and 75%). Error bars are y-axis standard deviation for each quantile.
Current usage metrics show cumulative count of Article Views (full-text article views including HTML views, PDF and ePub downloads, according to the available data) and Abstracts Views on Vision4Press platform.
Data correspond to usage on the plateform after 2015. The current usage metrics is available 48-96 hours after online publication and is updated daily on week days.
Initial download of the metrics may take a while.