Free Access
Fig. 1.
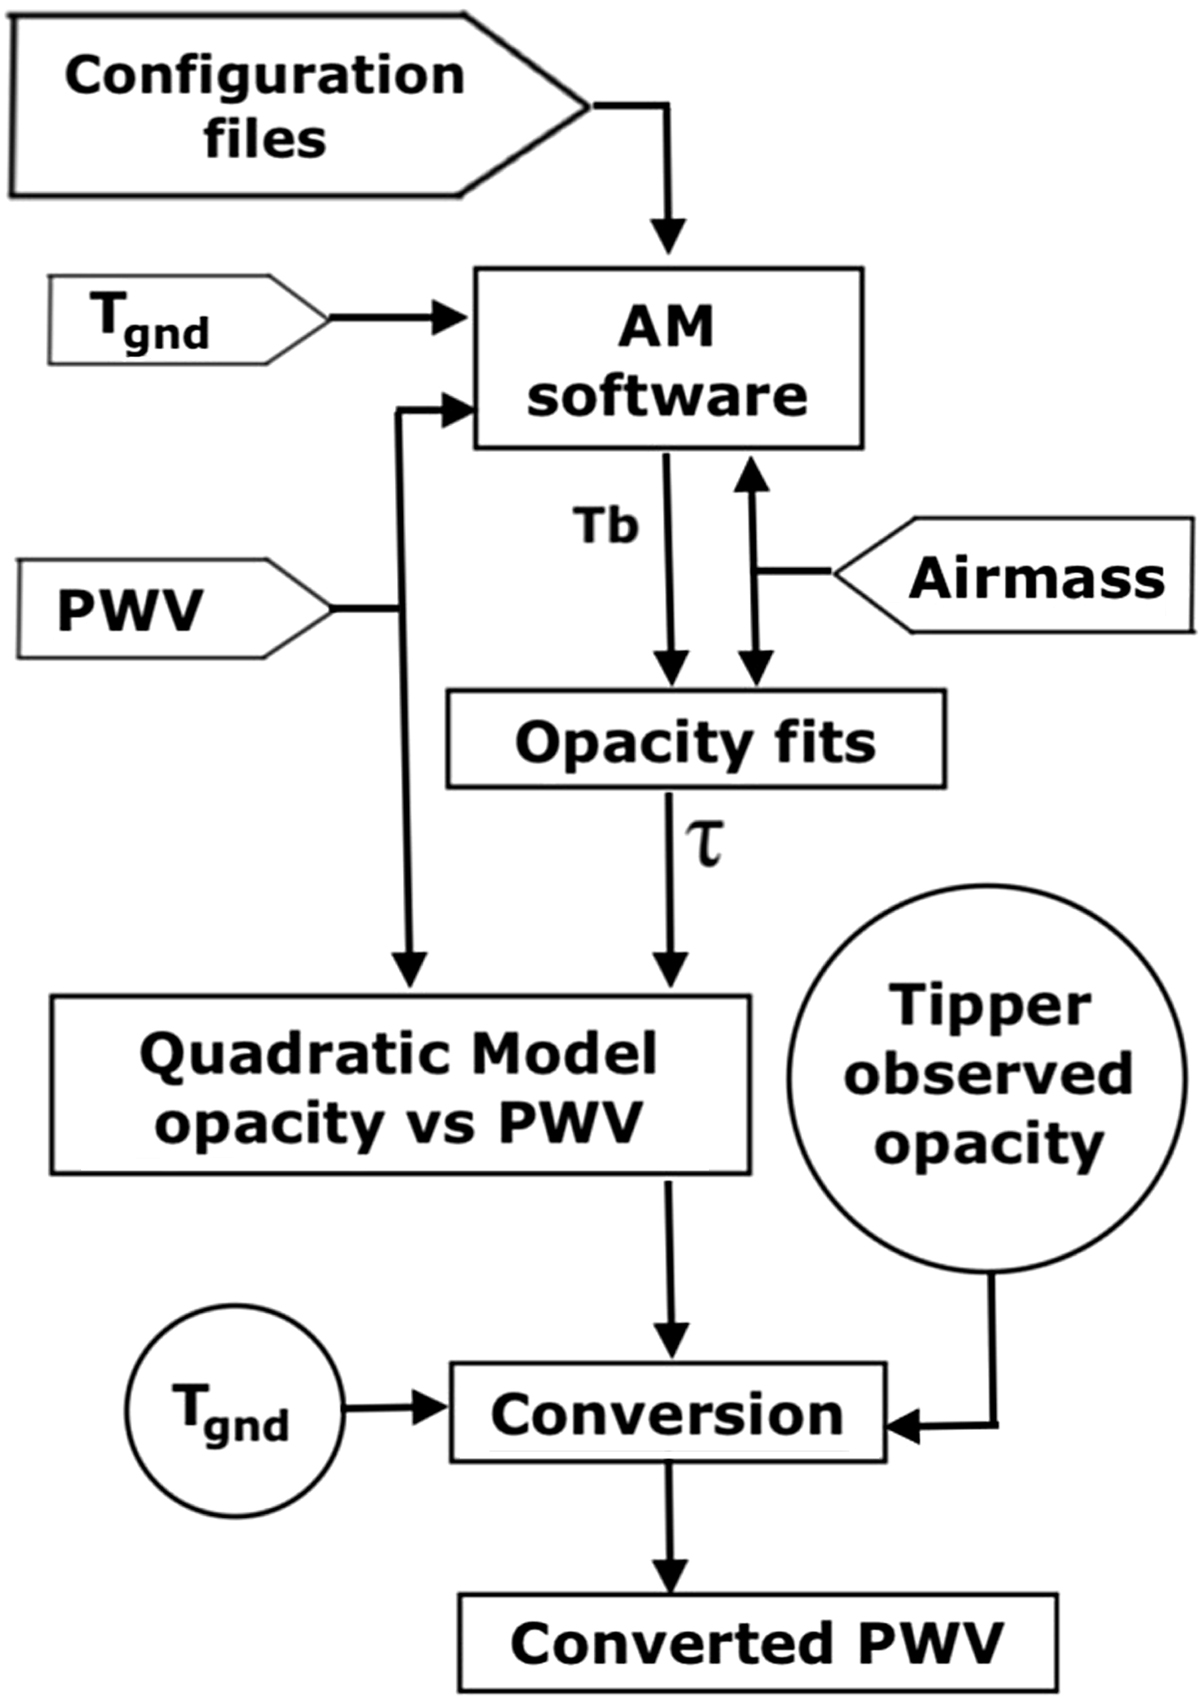
Illustrative block diagram describing the procedure to convert from measured tipper opacity to PWV. The one-end pointed rectangle blocks are considered inputs to the procedure, while the full rectangles are procedural actions. The circles represent experimental data coming from the submillimeter tipper.
Current usage metrics show cumulative count of Article Views (full-text article views including HTML views, PDF and ePub downloads, according to the available data) and Abstracts Views on Vision4Press platform.
Data correspond to usage on the plateform after 2015. The current usage metrics is available 48-96 hours after online publication and is updated daily on week days.
Initial download of the metrics may take a while.