Open Access
Fig. 6.
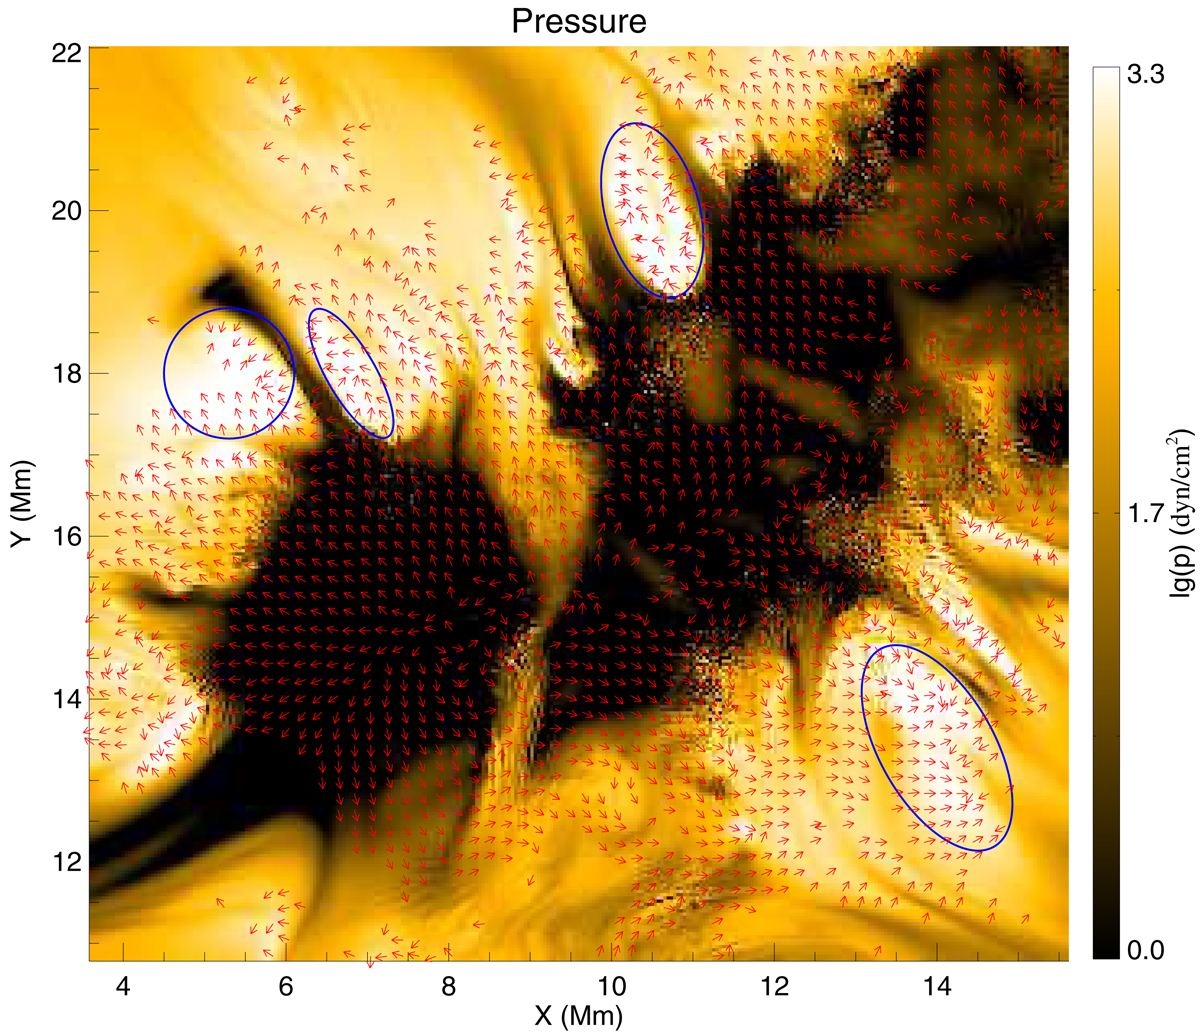
Two-dimensional Lorentz force vectors overplotted on the gas pressure at a height of 1.44 Mm. The plotted FOV is outlined by the red rectangle in Fig. 5(c). Blue ellipses encircle four typical regions where the gas pressure is enhanced.
Current usage metrics show cumulative count of Article Views (full-text article views including HTML views, PDF and ePub downloads, according to the available data) and Abstracts Views on Vision4Press platform.
Data correspond to usage on the plateform after 2015. The current usage metrics is available 48-96 hours after online publication and is updated daily on week days.
Initial download of the metrics may take a while.