Fig. 5.
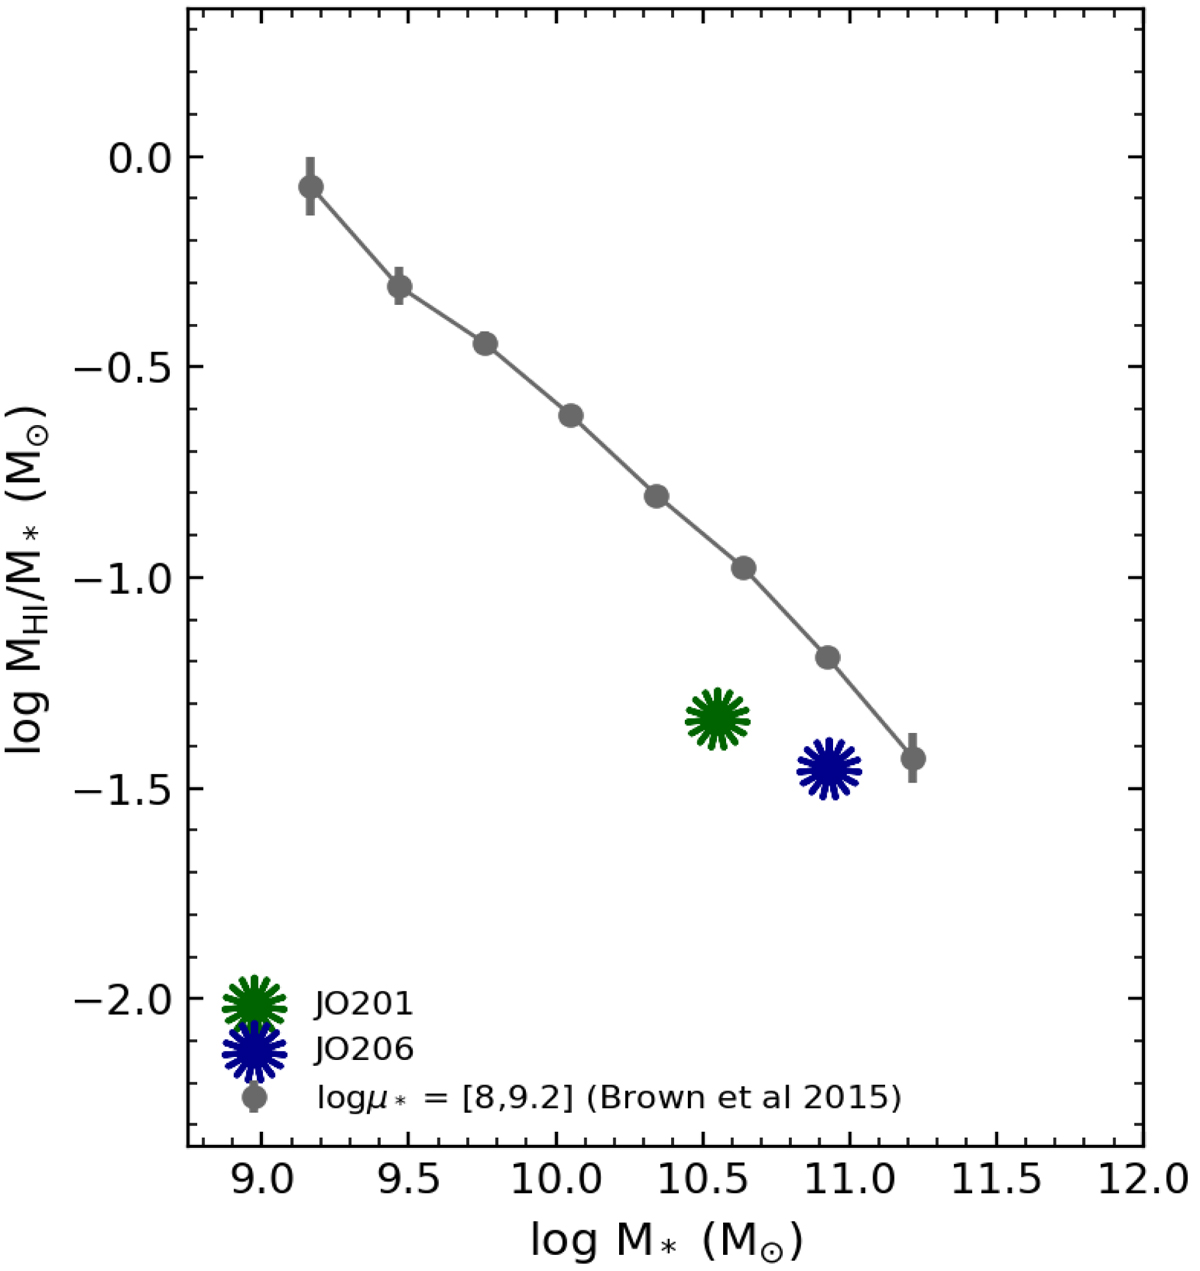
Average stacked H I fraction as function of the stellar mass (Brown et al. 2015). The relation is separated into galaxies with stellar surface brightness comparable to that of JO201 and JO206 within a factor of 4. The scatter in the mass bins is illustrate by the error bars. JO201 is represented by the green asterisk and JO206 by the blue asterisk.
Current usage metrics show cumulative count of Article Views (full-text article views including HTML views, PDF and ePub downloads, according to the available data) and Abstracts Views on Vision4Press platform.
Data correspond to usage on the plateform after 2015. The current usage metrics is available 48-96 hours after online publication and is updated daily on week days.
Initial download of the metrics may take a while.