Fig. 7.
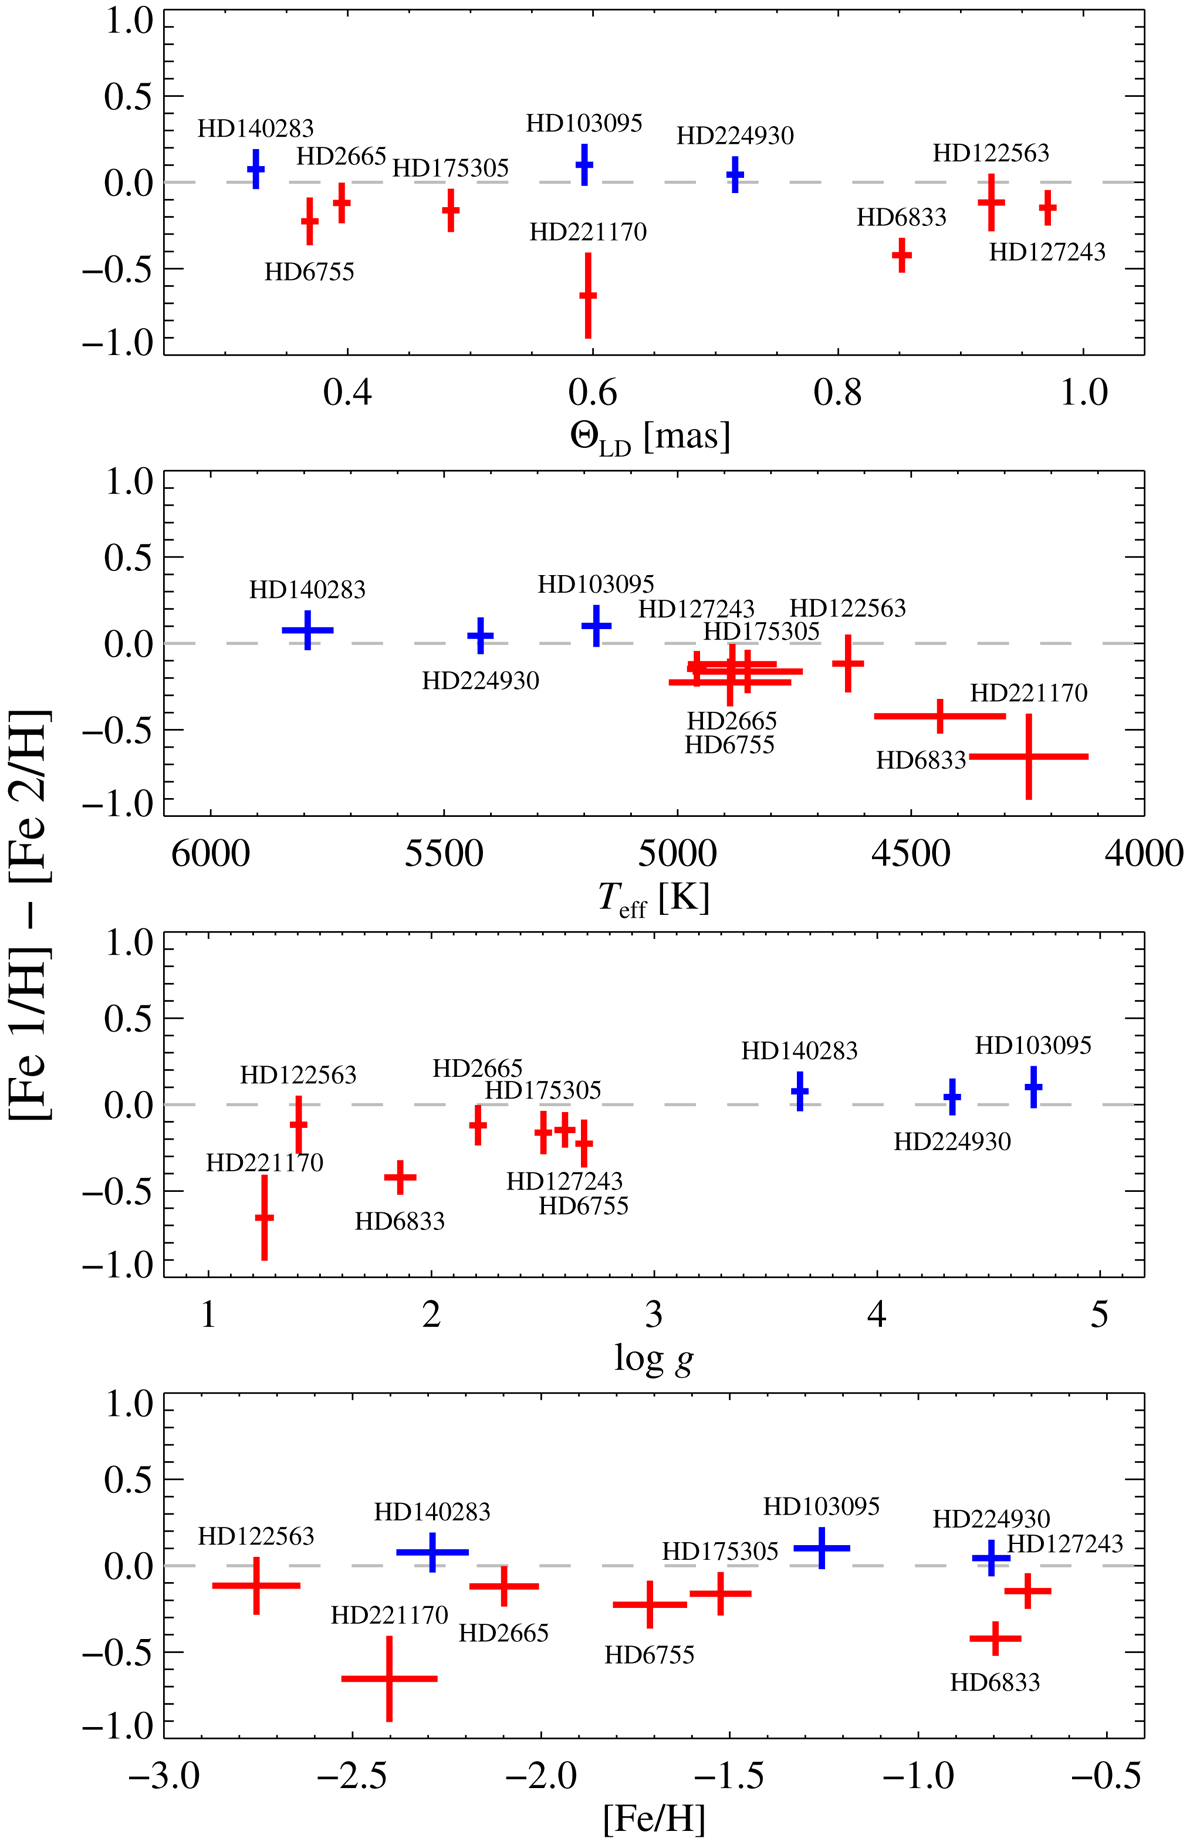
Deviations from ionisation balance, i.e. the difference between the abundances determined from lines of neutral and ionised iron, as a function of the measured stellar parameters. Vertical and horizontal lines represent the combined uncertainties from the two measurements. Each star is labelled, and colour-coded as red for red giants or blue for main sequence and subgiants.
Current usage metrics show cumulative count of Article Views (full-text article views including HTML views, PDF and ePub downloads, according to the available data) and Abstracts Views on Vision4Press platform.
Data correspond to usage on the plateform after 2015. The current usage metrics is available 48-96 hours after online publication and is updated daily on week days.
Initial download of the metrics may take a while.