Fig. 2.
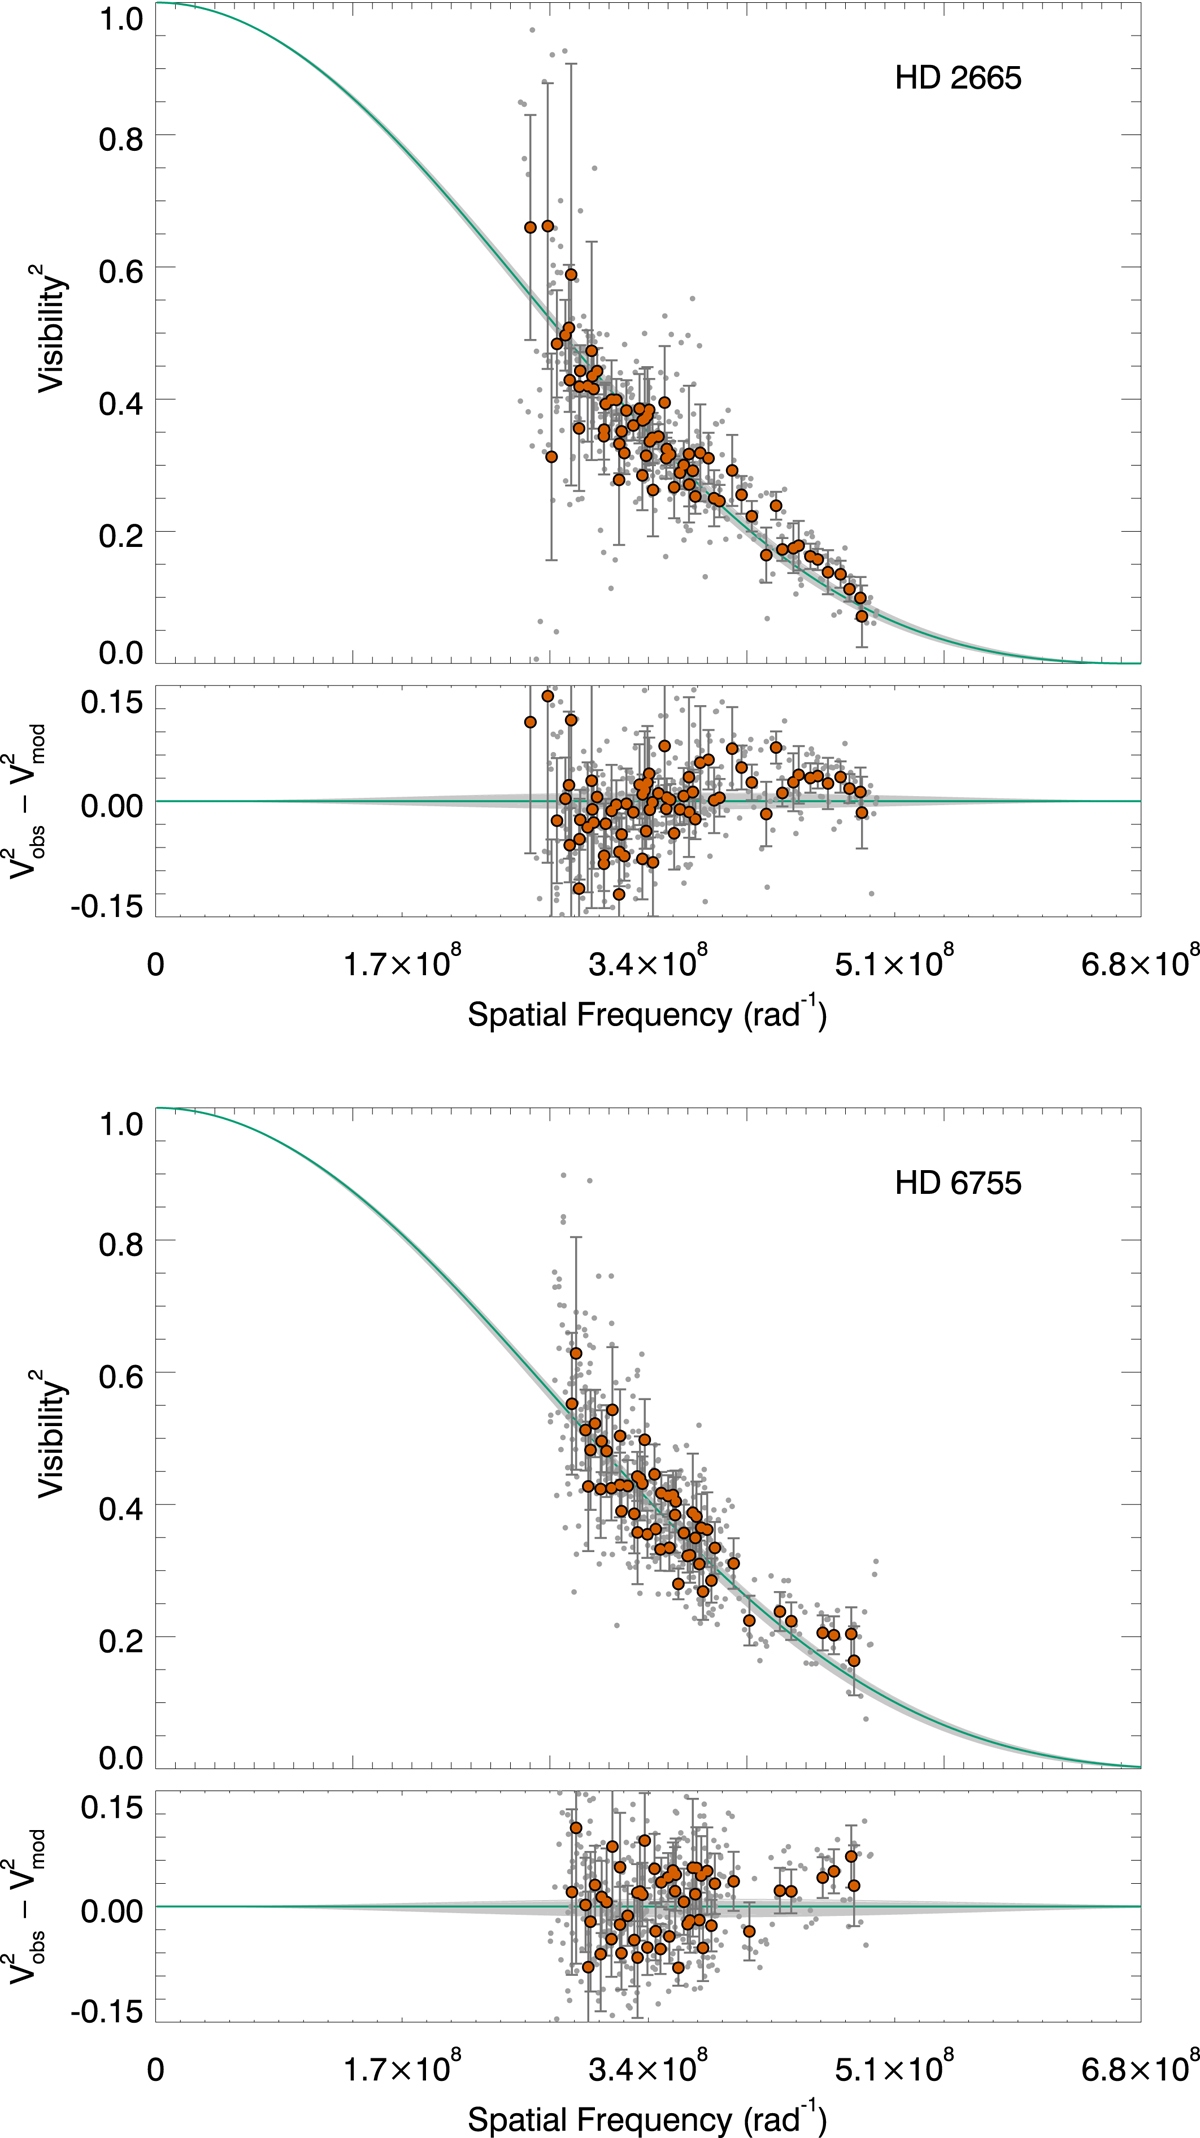
Squared visibility vs. spatial frequency for HD 2665 and HD 6755. The HD number is noted in the right upper corner in the each plot. The error bars have been scaled to the reduced χ2. For HD 2665 the reduced χ2 = 1.6 and for HD 6755 χ2 = 1.7. The grey dots are the individual PAVO measurements in each wavelength channel. For clarity, we show weighted averages of the PAVO measurements as red circles. The green line shows the fitted limb-darkened model to the PAVO data, with the light grey-shaded region indicating the 1-σ uncertainties. The lower panel shows the residuals from the fit.
Current usage metrics show cumulative count of Article Views (full-text article views including HTML views, PDF and ePub downloads, according to the available data) and Abstracts Views on Vision4Press platform.
Data correspond to usage on the plateform after 2015. The current usage metrics is available 48-96 hours after online publication and is updated daily on week days.
Initial download of the metrics may take a while.