Fig. 7.
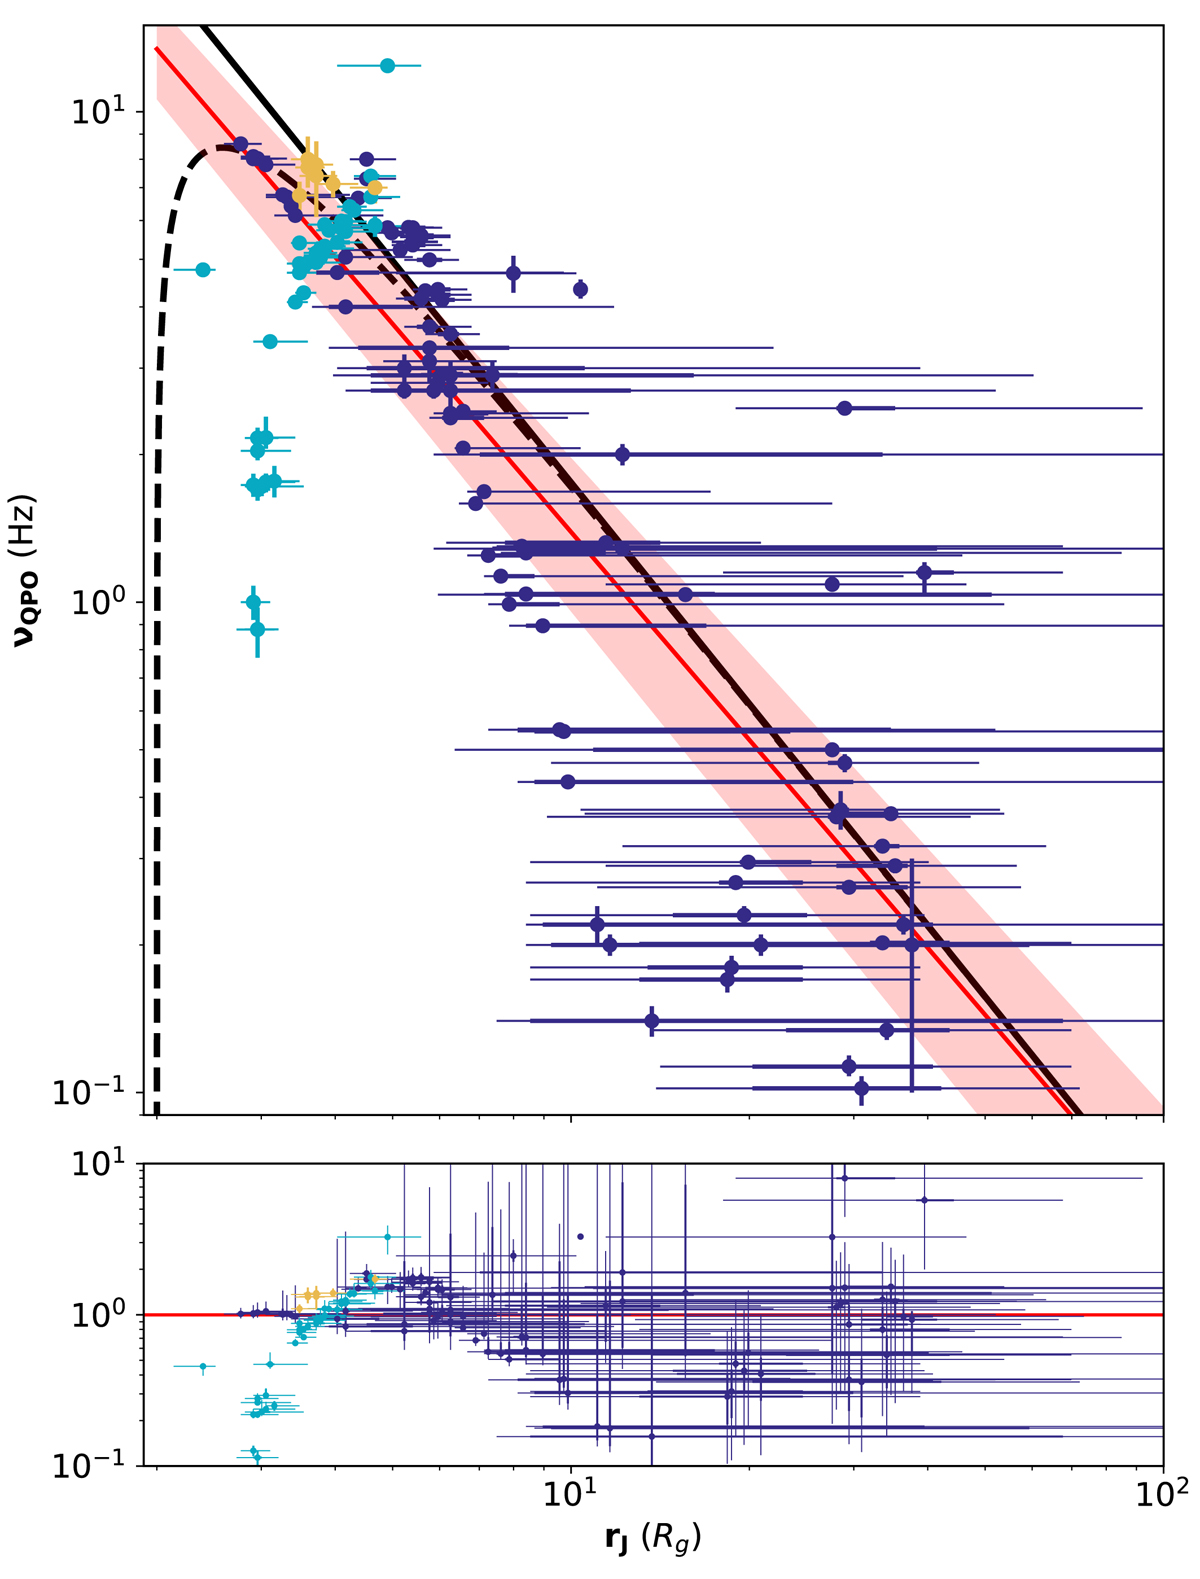
Correlation between observed frequency νQPO and the transition radius rJ (top), as well as the residuals defined as the ratio between the best weighted fit (in red) and the data (bottom). In their own colors, different types of quasi-periodic oscillations: Type A in light-yellow, Type B in cyan, Type C in dark-blue. In red the weighed linear fit considering only Type C LFQPOs, ![]() , in black νQPO = νK(rJ)/100, and in dashed-black νQPO = νep(rJ)/100.
, in black νQPO = νK(rJ)/100, and in dashed-black νQPO = νep(rJ)/100.
Current usage metrics show cumulative count of Article Views (full-text article views including HTML views, PDF and ePub downloads, according to the available data) and Abstracts Views on Vision4Press platform.
Data correspond to usage on the plateform after 2015. The current usage metrics is available 48-96 hours after online publication and is updated daily on week days.
Initial download of the metrics may take a while.