Fig. 5.
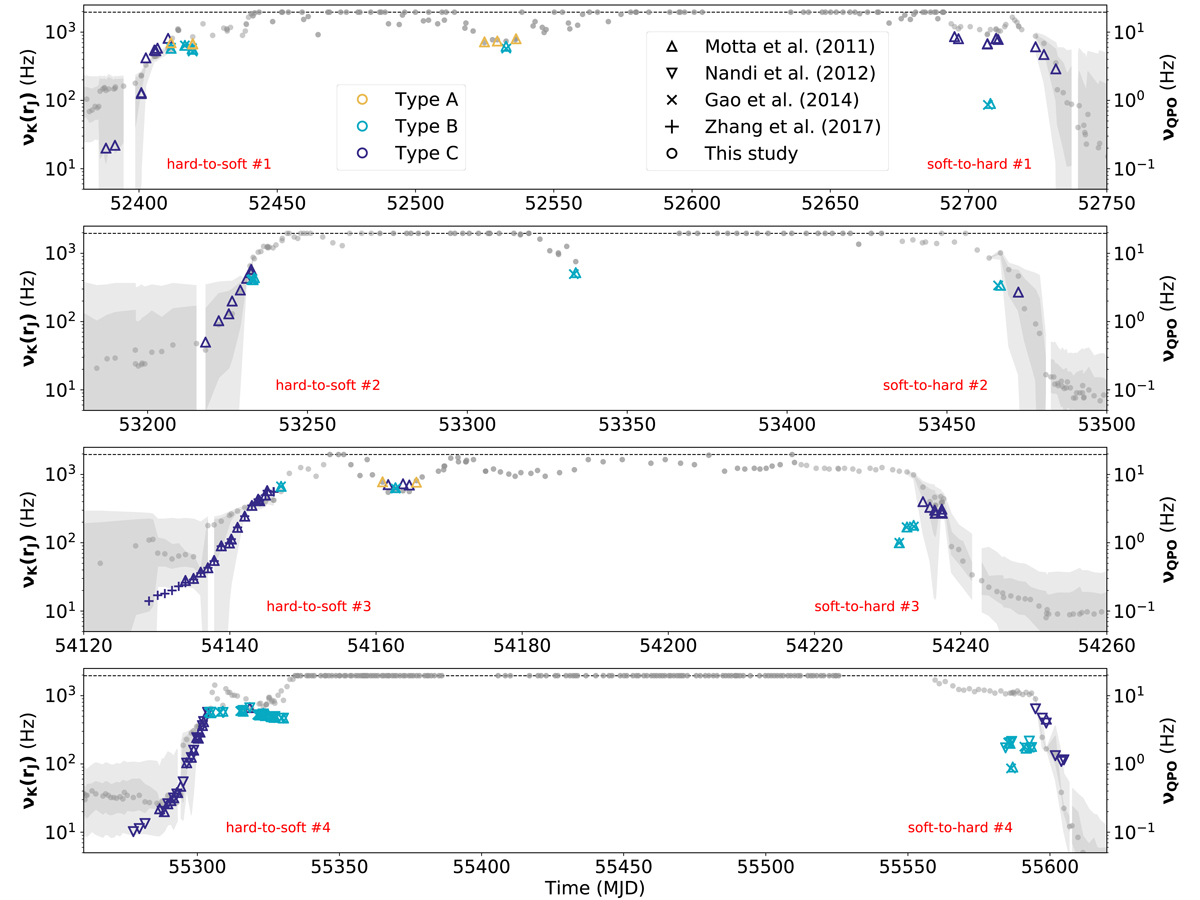
Co-evolution of the observed QPO frequency νQPO and the Kepler rotation frequency νK(rJ) for the 4 different outbursts, showing both hard-to-soft and soft-to-hard transitions (see red annotations). On the left Y-axis, the Kepler frequency at the transition radius, νK(rJ), and the 5% and 10% confidence intervals. On the right Y-axis, the observed QPO frequency, νQPO. Different markers are used to disentangle the different works: Motta et al. (2011) in upper-triangles, Nandi et al. (2012) in lower-triangles, Gao et al. (2014) in crosses, Zhang et al. (2017) in plus signs, and new detections in circle markers (see text). We also use different colors for the different types of QPOs (see legend).
Current usage metrics show cumulative count of Article Views (full-text article views including HTML views, PDF and ePub downloads, according to the available data) and Abstracts Views on Vision4Press platform.
Data correspond to usage on the plateform after 2015. The current usage metrics is available 48-96 hours after online publication and is updated daily on week days.
Initial download of the metrics may take a while.