Fig. 2.
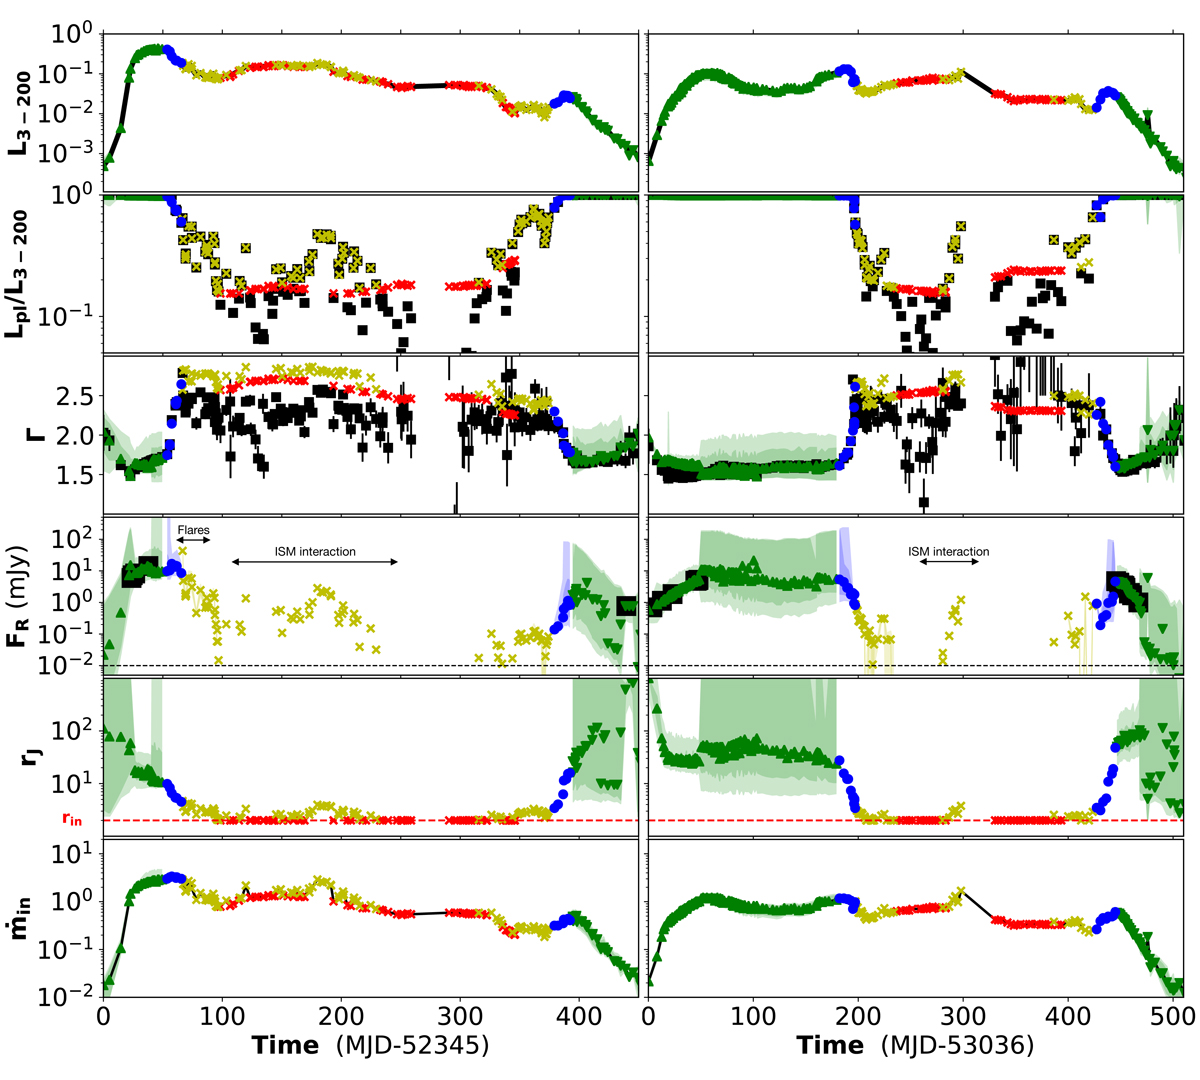
Observation and model parameters for cycles #1 (2002–2003, left) and #2 (2004–2005, right). From top to bottom: X-ray flux and power-law fraction in the 3 − 200 keV range, power-law index, 9 GHz radio flux, transition radius rJ, and inner accretion rate ṁin (at ISCO). For the first 4 panels, i.e., the constraints, black squares are observations. Each figure uses the same color-code: green upper- (lower-) triangles for the rising (decaying) hard, blue circles for hard-intermediate, yellow crosses for soft-intermediate, and red crosses for soft-states. Additionally, in the state-associated colors we draw the 5% and 10% confidence intervals (i.e., 5% and 10% bigger ζX + R, see Paper IV). Double arrows are drawn when radio emission was also observed but has been interpreted as radio flares or interactions with the interstellar medium (Corbel et al., in prep.).
Current usage metrics show cumulative count of Article Views (full-text article views including HTML views, PDF and ePub downloads, according to the available data) and Abstracts Views on Vision4Press platform.
Data correspond to usage on the plateform after 2015. The current usage metrics is available 48-96 hours after online publication and is updated daily on week days.
Initial download of the metrics may take a while.