Fig. 1.
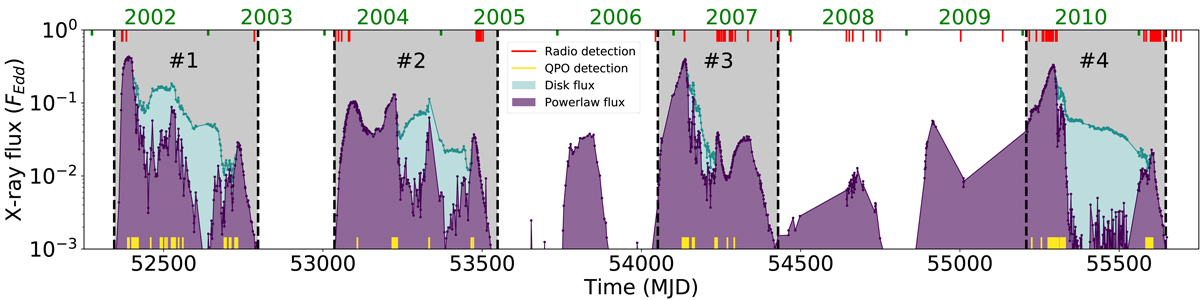
RTXE/PCA lightcurves of GX 339-4 in the 3 − 200 keV energy band from 2002 to 2011 (see upper X-axis). In filled colors, the power-law (violet), and disk (cyan) unabsorbed fluxes from the Clavel et al. (2016) fits. In gray, the area corresponding to the 4 complete outbursts (#1, #2, #3, #4). Red lines at the top correspond to dates when steady radio fluxes were observed with the Australia telescope compact array (ATCA) at 9 GHz (Corbel et al. 2013a,b). Yellow lines at the bottom show previous detections of quasi-periodic oscillations (QPO, Motta et al. 2011; Nandi et al. 2012; Gao et al. 2014; Zhang et al. 2017).
Current usage metrics show cumulative count of Article Views (full-text article views including HTML views, PDF and ePub downloads, according to the available data) and Abstracts Views on Vision4Press platform.
Data correspond to usage on the plateform after 2015. The current usage metrics is available 48-96 hours after online publication and is updated daily on week days.
Initial download of the metrics may take a while.