Fig. 9.
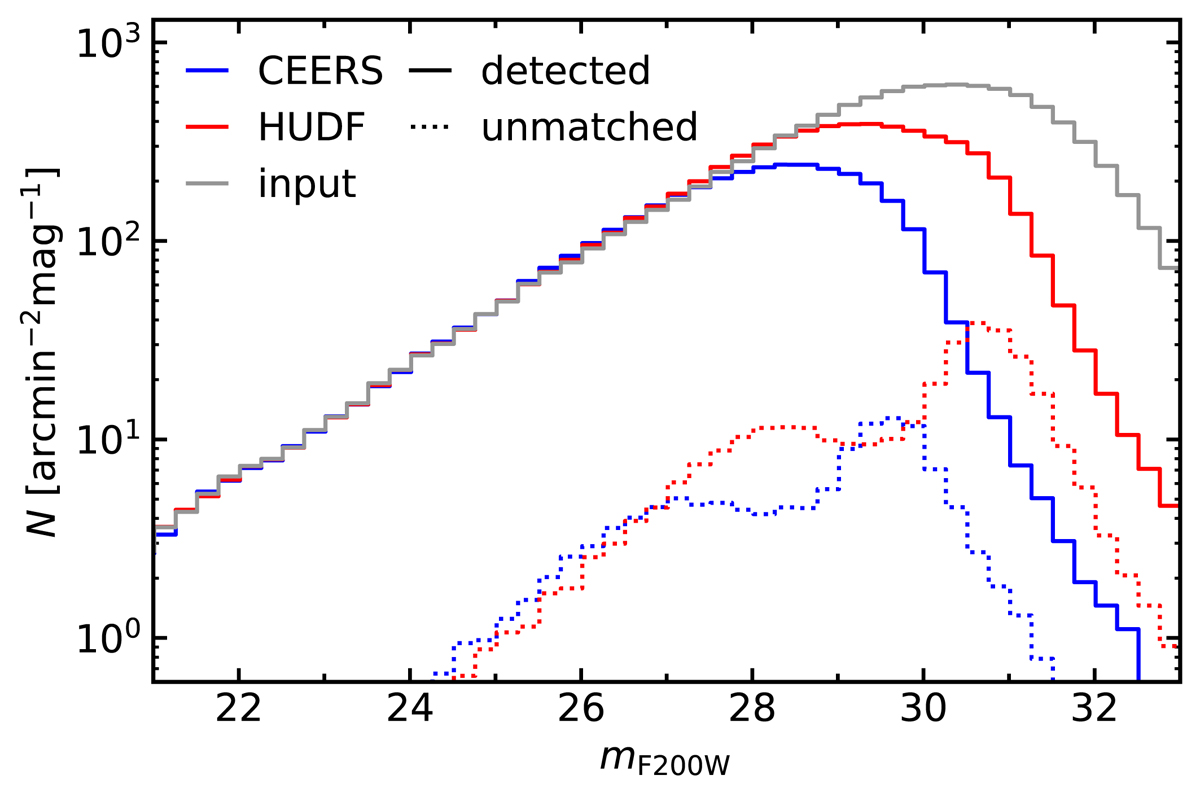
Detected source number counts versus NIRCam/F200W magnitude. The gray line indicates the input magnitudes of all the mock galaxies. The colored lines illustrate the measured magnitudes of detected sources in our CEERS and HUDF simulations. The solid lines include all the detected sources, the dashed lines represent unmatched sources only.
Current usage metrics show cumulative count of Article Views (full-text article views including HTML views, PDF and ePub downloads, according to the available data) and Abstracts Views on Vision4Press platform.
Data correspond to usage on the plateform after 2015. The current usage metrics is available 48-96 hours after online publication and is updated daily on week days.
Initial download of the metrics may take a while.