Open Access
Fig. 7.
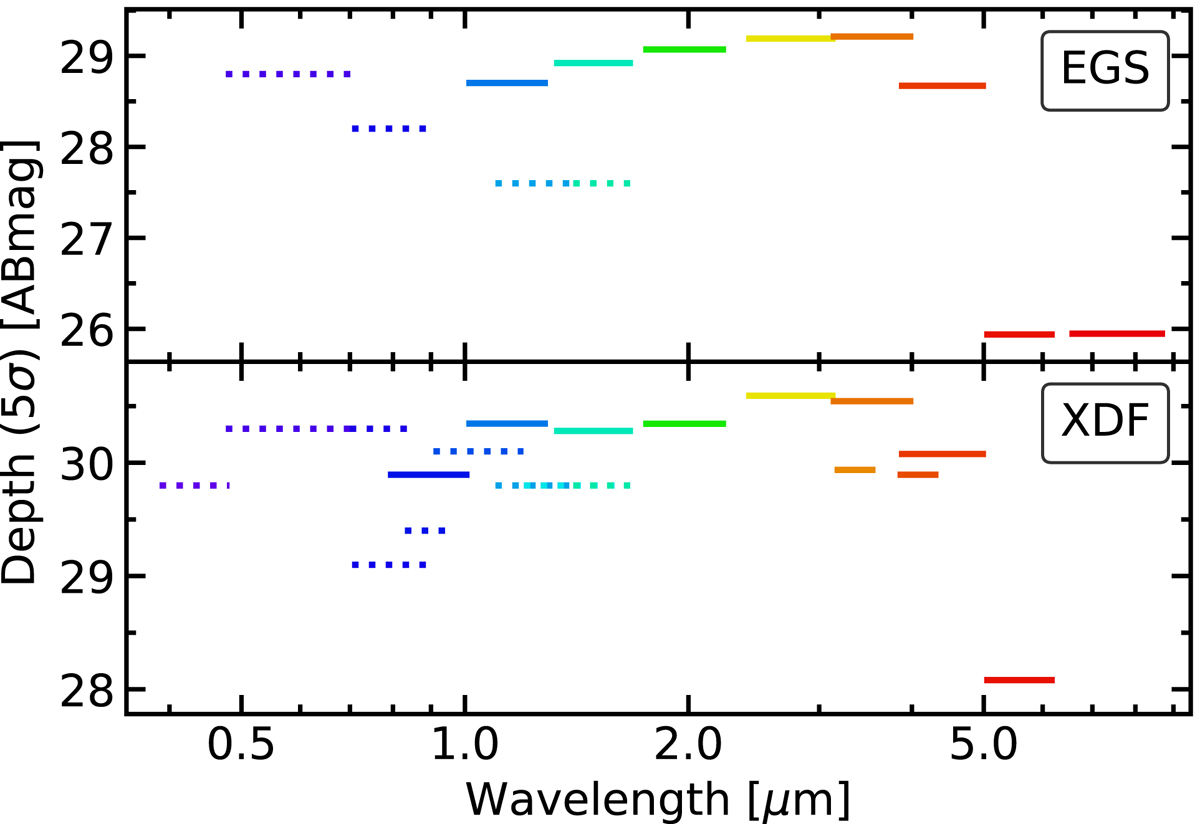
Limiting magnitudes at 5σ in the simulated data sets in the EGS field (top) and the XDF (bottom). The list of bands and depths are listed in Tables 1 and 2. The solid lines represent the JWST bands and the dotted lines represent HST bands. The length of each segment is the FWHM of the filter transmission curve.
Current usage metrics show cumulative count of Article Views (full-text article views including HTML views, PDF and ePub downloads, according to the available data) and Abstracts Views on Vision4Press platform.
Data correspond to usage on the plateform after 2015. The current usage metrics is available 48-96 hours after online publication and is updated daily on week days.
Initial download of the metrics may take a while.