Open Access
Fig. 5.
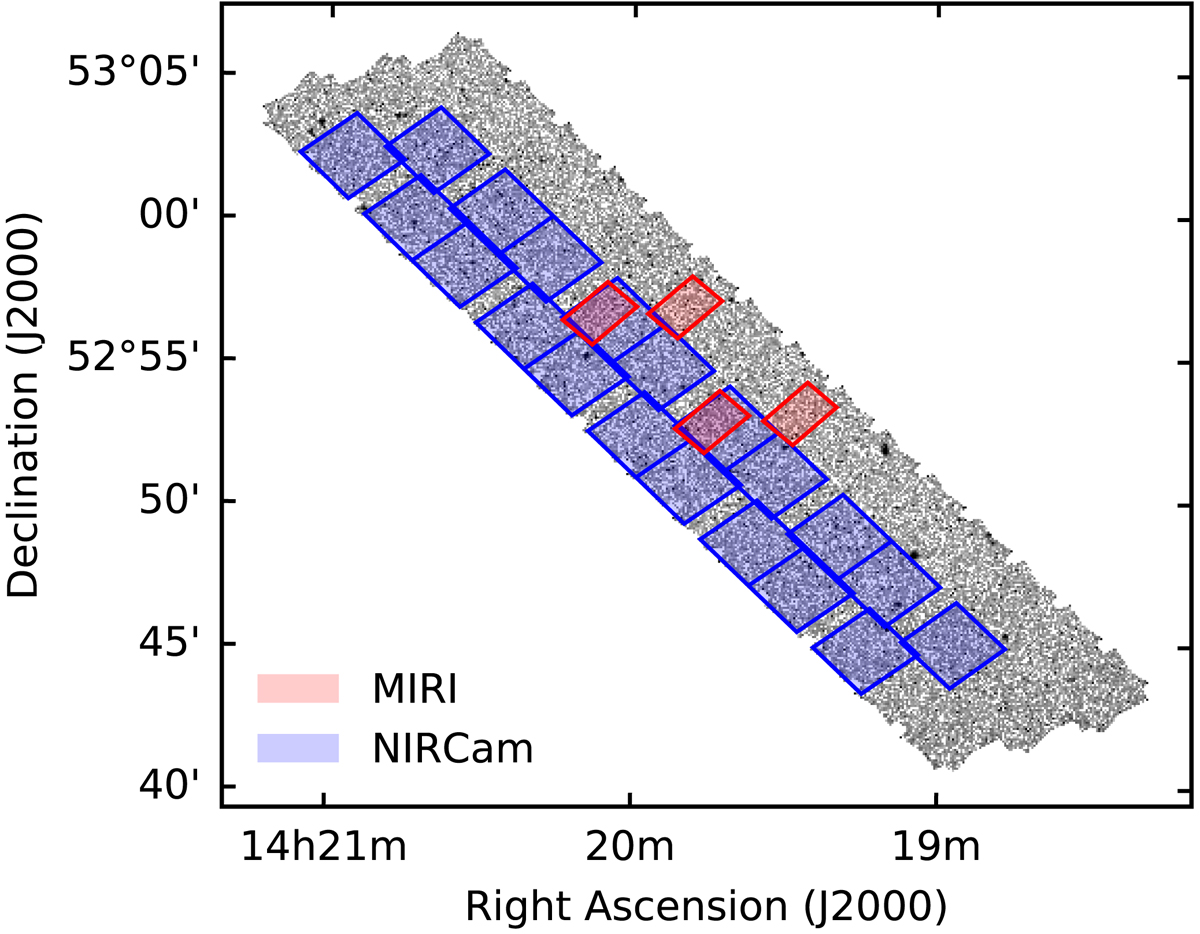
CEERS layout in the EGS field. The 10 NIRcam imaging pointings are shown in blue and the 4 MIRI parallels in red. The ancillary HST/WFC3 H160-band coverage is in gray. The pointings are all approximate until the final schedule. The parallel NIRSpec observations are not represented for clarity.
Current usage metrics show cumulative count of Article Views (full-text article views including HTML views, PDF and ePub downloads, according to the available data) and Abstracts Views on Vision4Press platform.
Data correspond to usage on the plateform after 2015. The current usage metrics is available 48-96 hours after online publication and is updated daily on week days.
Initial download of the metrics may take a while.