Fig. 21.
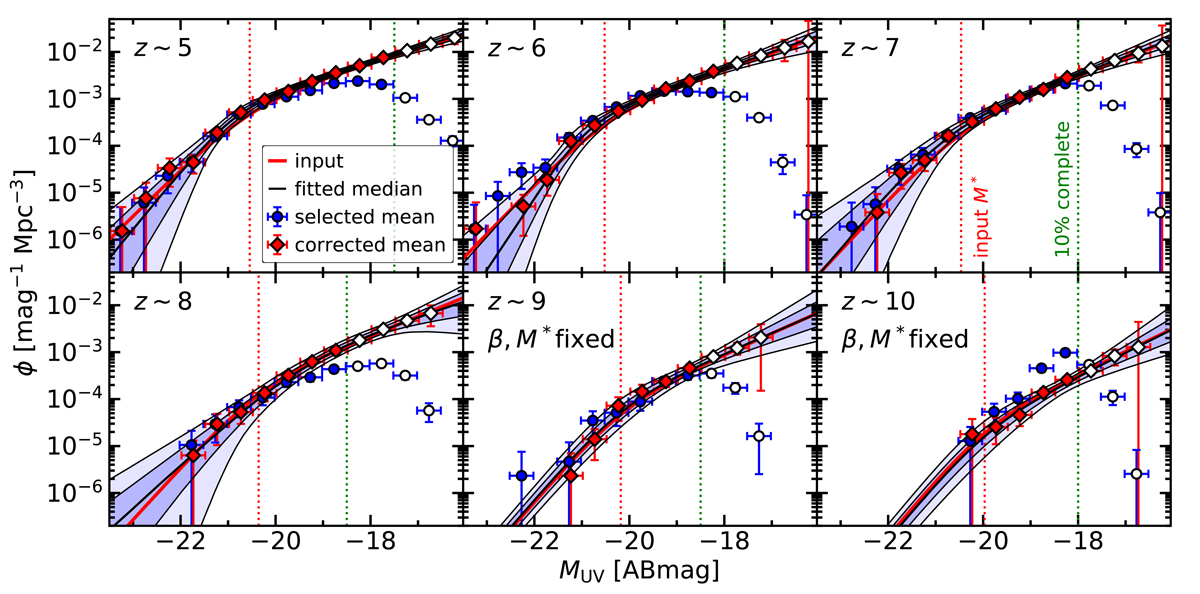
Galaxy UV luminosity functions for multiple redshift intervals, for the CEERS_1 observing strategy. The blue dots indicate the estimated mean of the selected counts, and the red diamonds represent the selected counts corrected for incompleteness and impurity. The open symbols are the points where the completeness is below 10%. The error bars are Poisson errors for the former and the quadratic sum of Poisson and scaling errors for the latter. Multiple Poisson random vectors are sampled from the blue dots, scaled to correct for incompleteness and impurity and fitted with a double power-law function, with the indicated fixed parameters. The black lines show the model with the median fitted parameters, after marginalizing over all the sampled counts. The colored areas indicate 1σ and 2σ credibility errors. The red lines represent the input luminosity functions (fitted with a DPL model). The dotted red lines show M* from the input LF, and the dotted green lines indicate the 10% completeness limit.
Current usage metrics show cumulative count of Article Views (full-text article views including HTML views, PDF and ePub downloads, according to the available data) and Abstracts Views on Vision4Press platform.
Data correspond to usage on the plateform after 2015. The current usage metrics is available 48-96 hours after online publication and is updated daily on week days.
Initial download of the metrics may take a while.