Fig. 2.
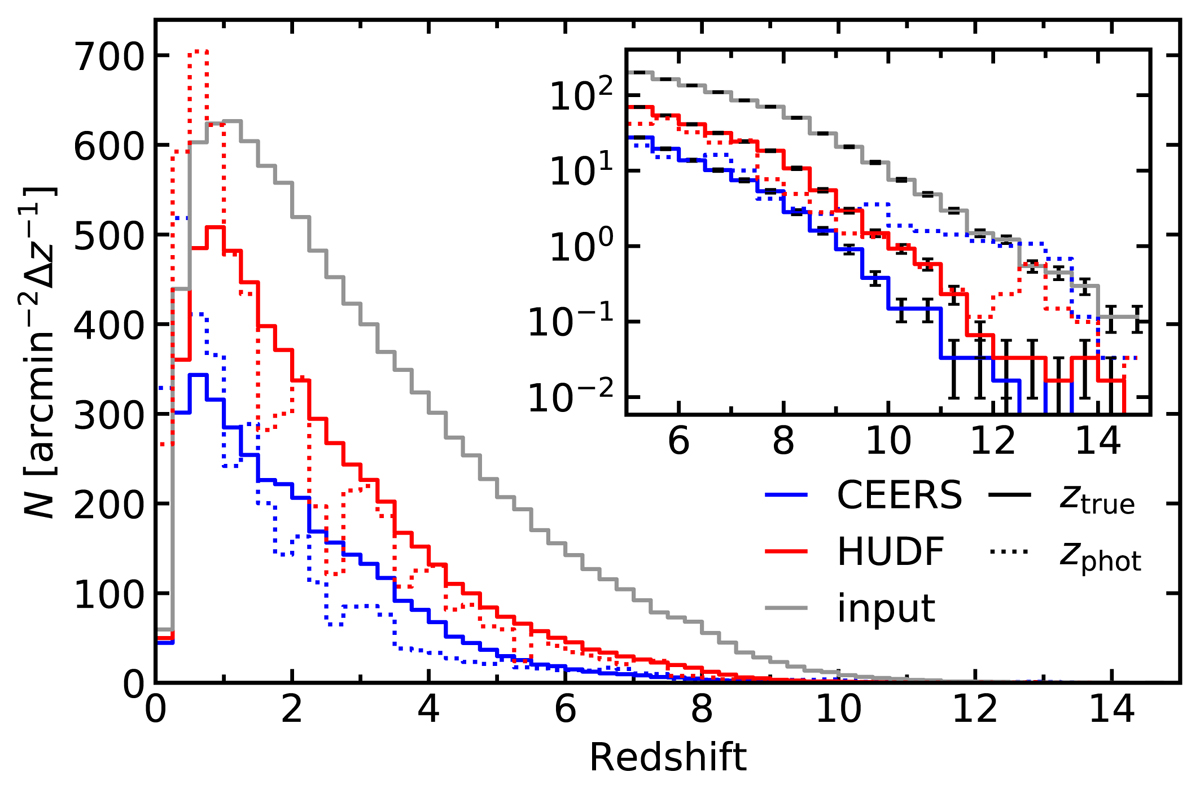
Galaxy surface number density versus redshift. The gray line includes all the mock galaxies with stellar masses log(M*/M⊙) > 6. The colored lines illustrate the redshift distribution of the detected sources in our CEERS and HUDF simulations. The solid and dashed lines represent input and photometric redshift distributions, respectively. The inset provides a zoom-in at high redshift, with Poisson error bars.
Current usage metrics show cumulative count of Article Views (full-text article views including HTML views, PDF and ePub downloads, according to the available data) and Abstracts Views on Vision4Press platform.
Data correspond to usage on the plateform after 2015. The current usage metrics is available 48-96 hours after online publication and is updated daily on week days.
Initial download of the metrics may take a while.