Fig. 19.
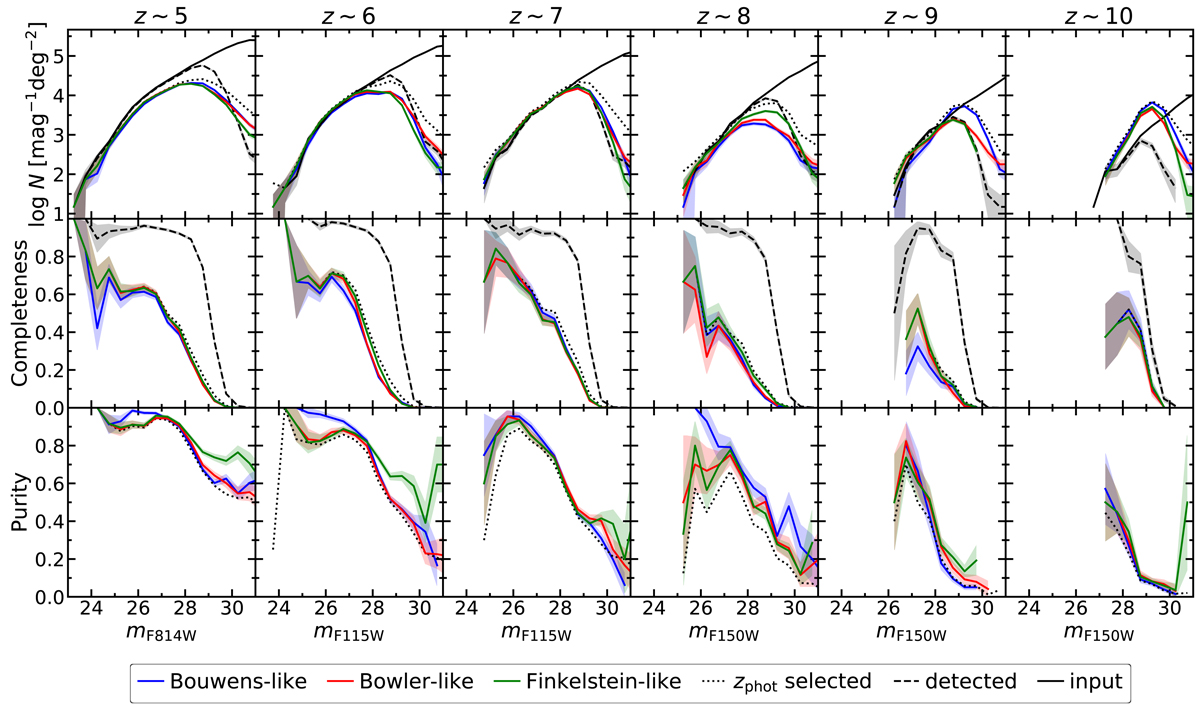
High-redshift galaxy number counts (top panels), completeness (middle panels) and purity (bottom panels) versus apparent magnitude (in the band the nearest to rest-frame UV), in the CEERS_1 observing strategy. Each column corresponds to one redshift interval. Each colored line represents one set of selection criteria from Table 3. The solid black lines indicate the input number counts. The dashed black lines illustrate detected sources assuming the redshifts are perfectly recovered. The dotted black lines represent observed sources selected with photometric redshifts only. The shaded areas correspond to 1σ errors. The input and detected counts, and the measured completeness, are expressed in true magnitudes, while the selected counts and purity measurements are in observed magnitudes.
Current usage metrics show cumulative count of Article Views (full-text article views including HTML views, PDF and ePub downloads, according to the available data) and Abstracts Views on Vision4Press platform.
Data correspond to usage on the plateform after 2015. The current usage metrics is available 48-96 hours after online publication and is updated daily on week days.
Initial download of the metrics may take a while.