Fig. 17.
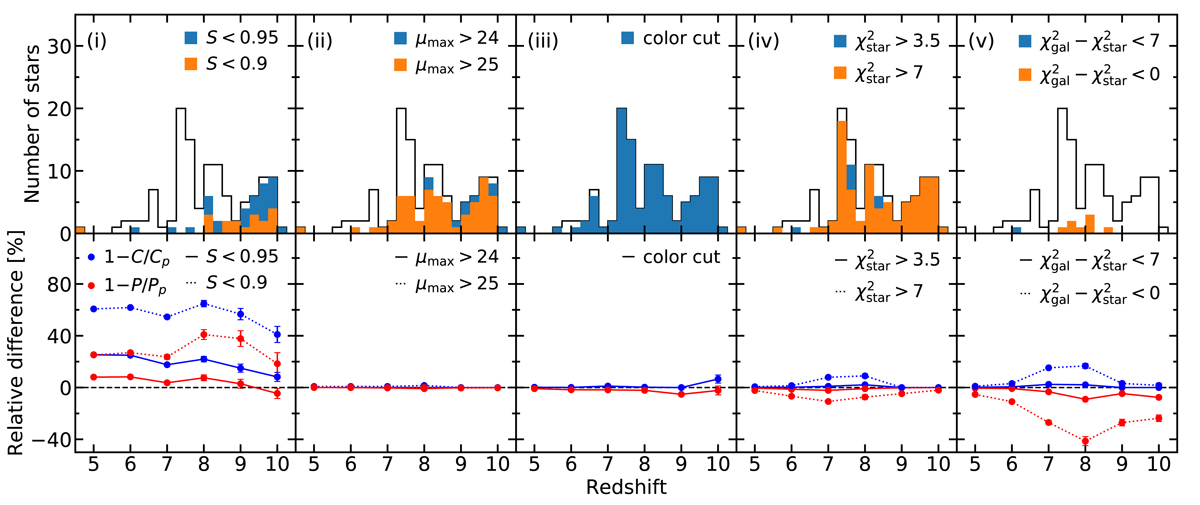
Top panels: number of remaining stellar contaminants after applying the indicated selection criterion per photometric redshift interval, in the CEERS_1 observing strategy. Each column corresponds to one type of selection from Sect. 5.1. The black line indicates the photometric redshift distribution of the detected stars with zphot > 5. All the stars with lower photometric redshifts have zphot < 2. The colored bars represent the remaining stars after applying the indicated selection criterion. The soft selection (in blue) is always less restrictive than the stringent one (in orange), meaning that all second counts are also included in the first counts. Bottom panels: completeness C (in blue) and purity P (in red) of the high-redshift galaxy samples versus true redshift (integrated over magnitudes). The references Cp and Pp represent the completeness and purity assuming the selection is based on photometric redshifts only. The relative difference with respect to the reference is represented, so that positive values indicate lower completeness and purity. Different line styles represent the results for different selection criteria (as indicated in each panel).
Current usage metrics show cumulative count of Article Views (full-text article views including HTML views, PDF and ePub downloads, according to the available data) and Abstracts Views on Vision4Press platform.
Data correspond to usage on the plateform after 2015. The current usage metrics is available 48-96 hours after online publication and is updated daily on week days.
Initial download of the metrics may take a while.