Fig. 12.
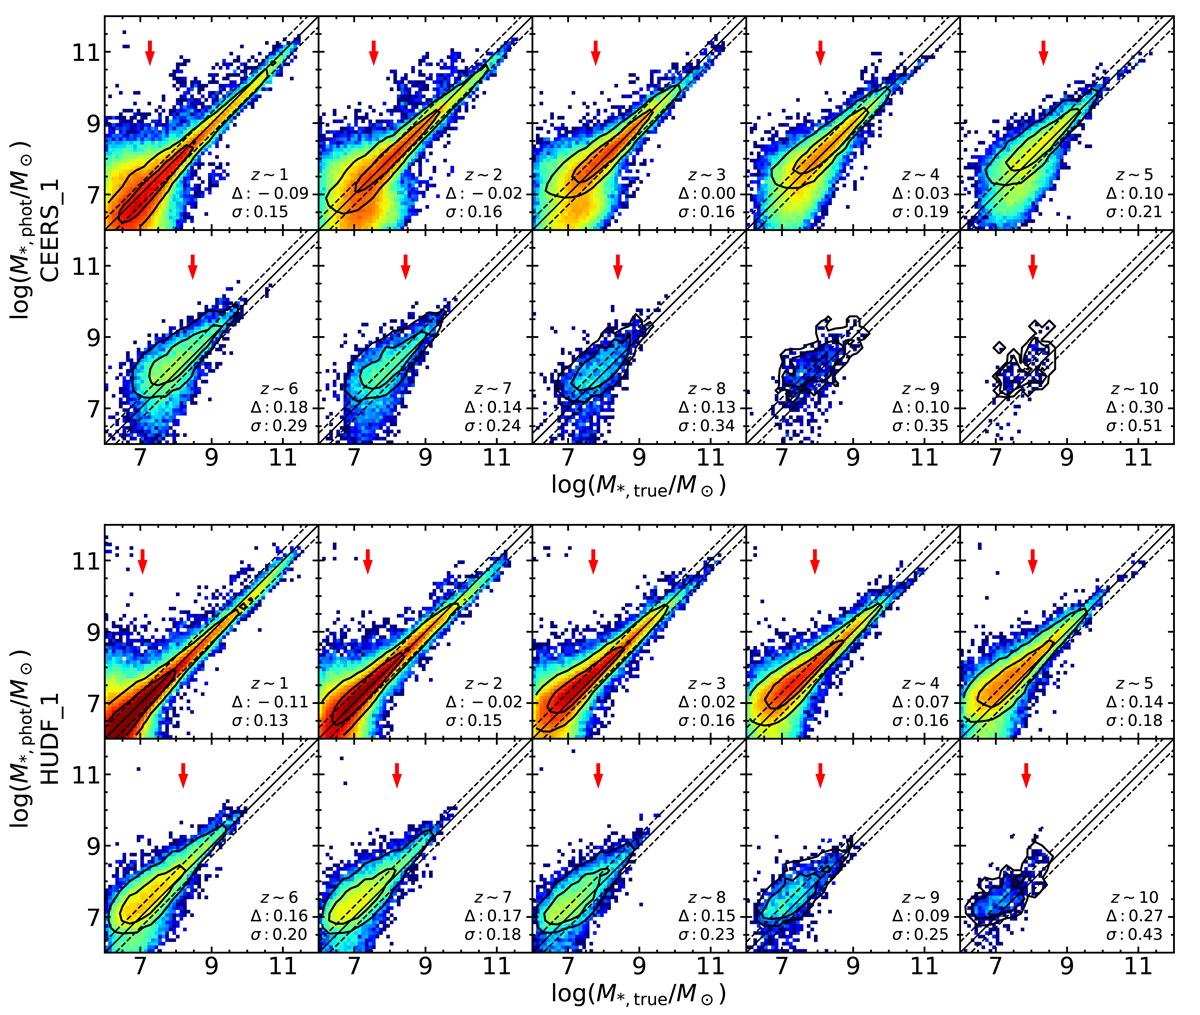
Comparison between measured and input stellar masses, for the CEERS_1 and HUDF_1 observing strategies (top and bottom figures, respectively). Each panel represents an input redshift interval centered at ztrue = 1, 2, 3, … of width Δz = 1. Color indicates the number of sources in the whole sample, with the same color scale as in Fig. 10. The thick black contours represent the distribution of the sources with correct photometric redshift |zphot − ztrue|< 0.15ztrue, including 68% and 95% of these sources, respectively. The median shift (Δ) and the NMAD (σ) for the sources with correct zphot and 8 < log(M*, true/M⊙) < 10 are indicated (in dex). The solid line shows the 1:1 relation and the dashed lines ±0.3 dex. The red arrows indicate the detected 90% stellar mass completeness.
Current usage metrics show cumulative count of Article Views (full-text article views including HTML views, PDF and ePub downloads, according to the available data) and Abstracts Views on Vision4Press platform.
Data correspond to usage on the plateform after 2015. The current usage metrics is available 48-96 hours after online publication and is updated daily on week days.
Initial download of the metrics may take a while.