Fig. 11.
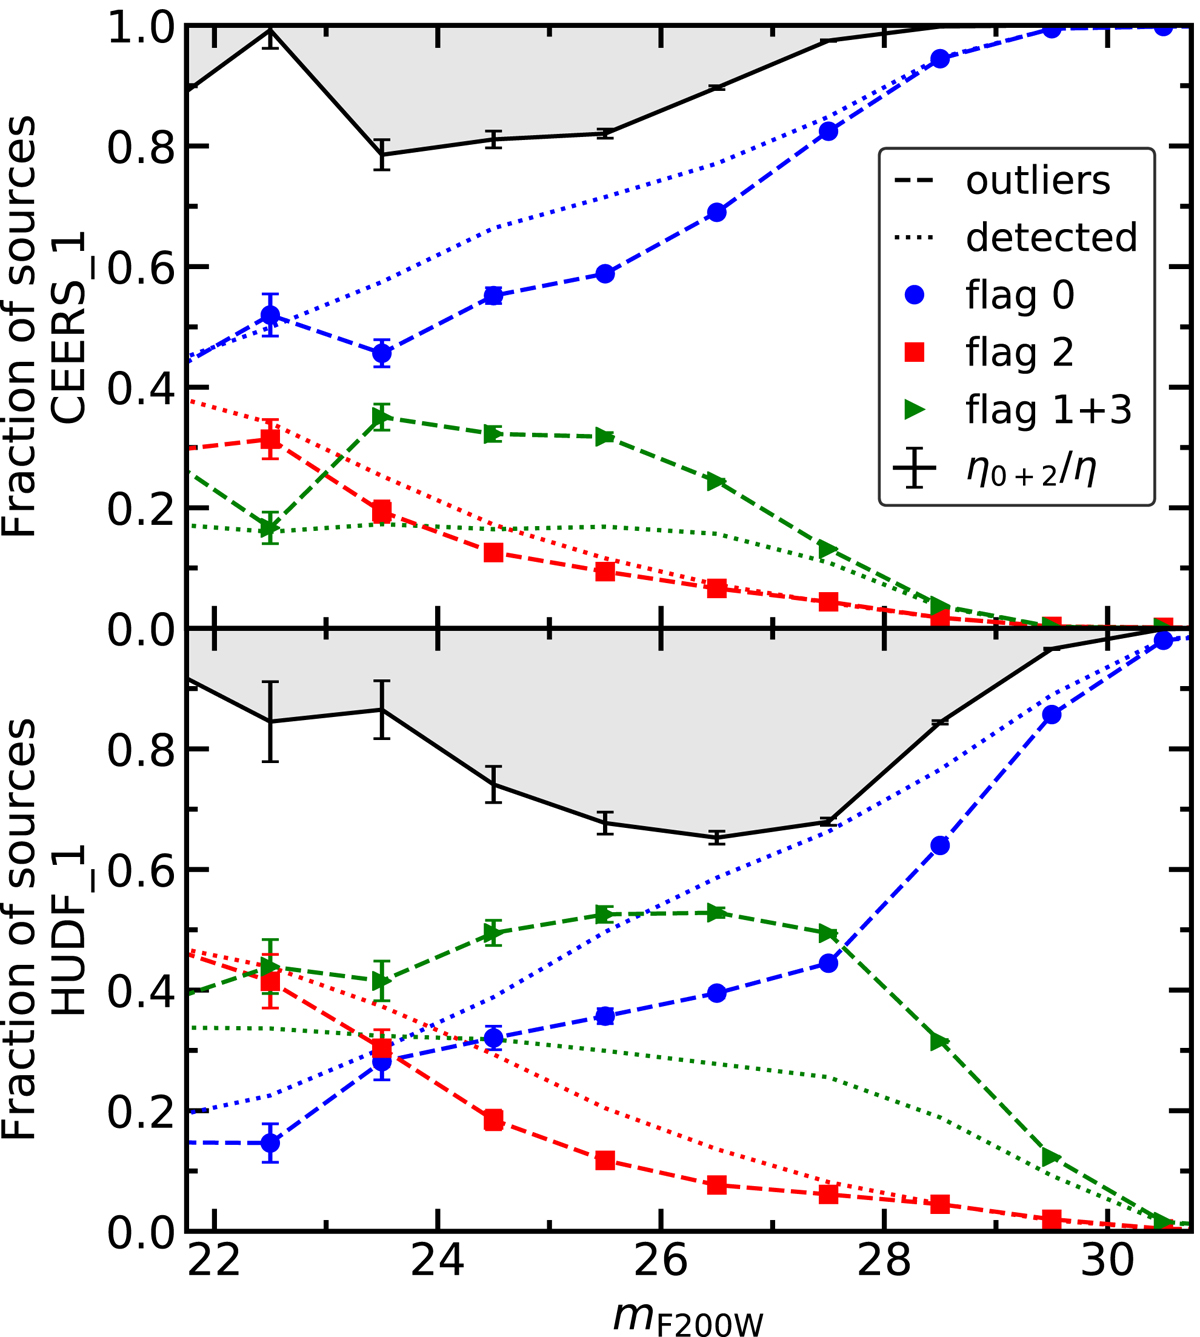
Fraction of detected sources per SExtractor flags indicating blending (flag 2), contaminated photometry (flag 1), both (flag 3) or none (flag 0) versus observed NIRCam/F200W magnitude. The rows correspond to the CEERS_1 (top) and HUDF_1 (bottom) observing strategies. The dashed lines indicate the flag fractions among photometric redshift outliers (summing to one), as defined in Sect. 4.1. The dotted lines represent the flag fractions in the whole detected sample (summing to one). The solid black line shows the ratio between the photometric redshift outlier rates η0 + 2 assuming all the sources have uncontaminated photometry (flags 0 or 2), and the standard outlier rates. The error bars are propagated Poisson errors.
Current usage metrics show cumulative count of Article Views (full-text article views including HTML views, PDF and ePub downloads, according to the available data) and Abstracts Views on Vision4Press platform.
Data correspond to usage on the plateform after 2015. The current usage metrics is available 48-96 hours after online publication and is updated daily on week days.
Initial download of the metrics may take a while.