Fig. 10.
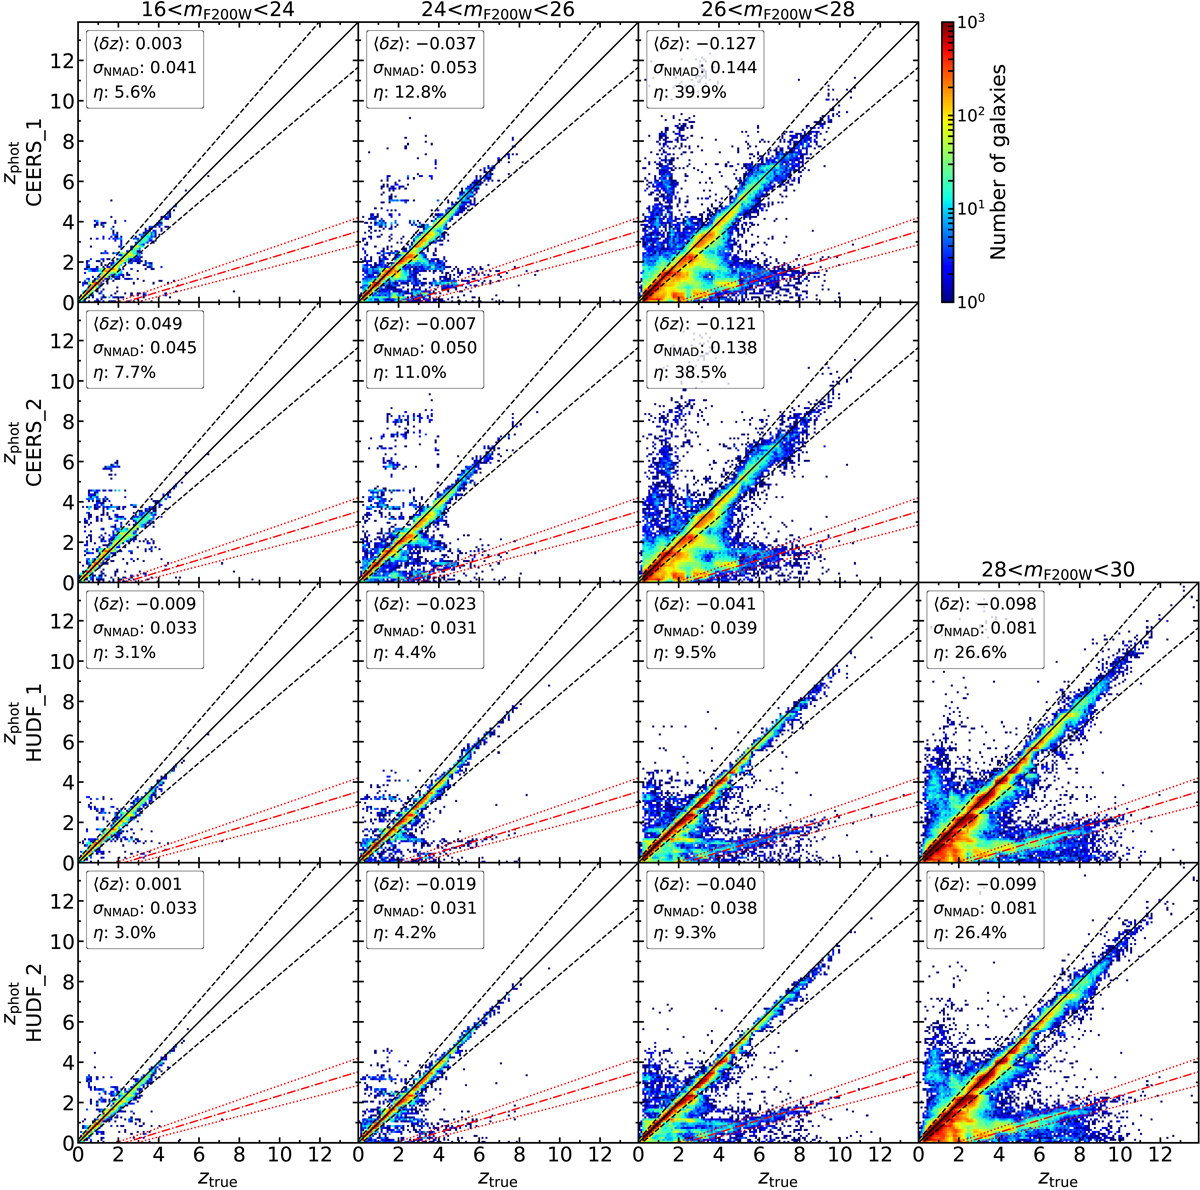
Comparison between photometric and true redshifts, “true” redshifts being in this case the simulated redshifts as described in Sect. 2.1. The rows correspond to CEERS_1, CEERS_2, HUDF_1 and HUDF_2 observing strategies from top to bottom, and the columns represent observed NIRCam/F200W magnitude intervals. Color indicates the number of sources. The mean normalized residual, the normalized median absolute deviation and the catastrophic error fraction η for all the detected sources are indicated. The solid black line shows the 1:1 relation and the dashed black lines the ±0.15(1 + ztrue) threshold used to compute η. The degeneracy between the Balmer 4000 Å break and the Lyα 1216 Å break is identified by the dotted-dashed red line, with 15% errors in dotted red lines.
Current usage metrics show cumulative count of Article Views (full-text article views including HTML views, PDF and ePub downloads, according to the available data) and Abstracts Views on Vision4Press platform.
Data correspond to usage on the plateform after 2015. The current usage metrics is available 48-96 hours after online publication and is updated daily on week days.
Initial download of the metrics may take a while.