Open Access
Fig. 1.
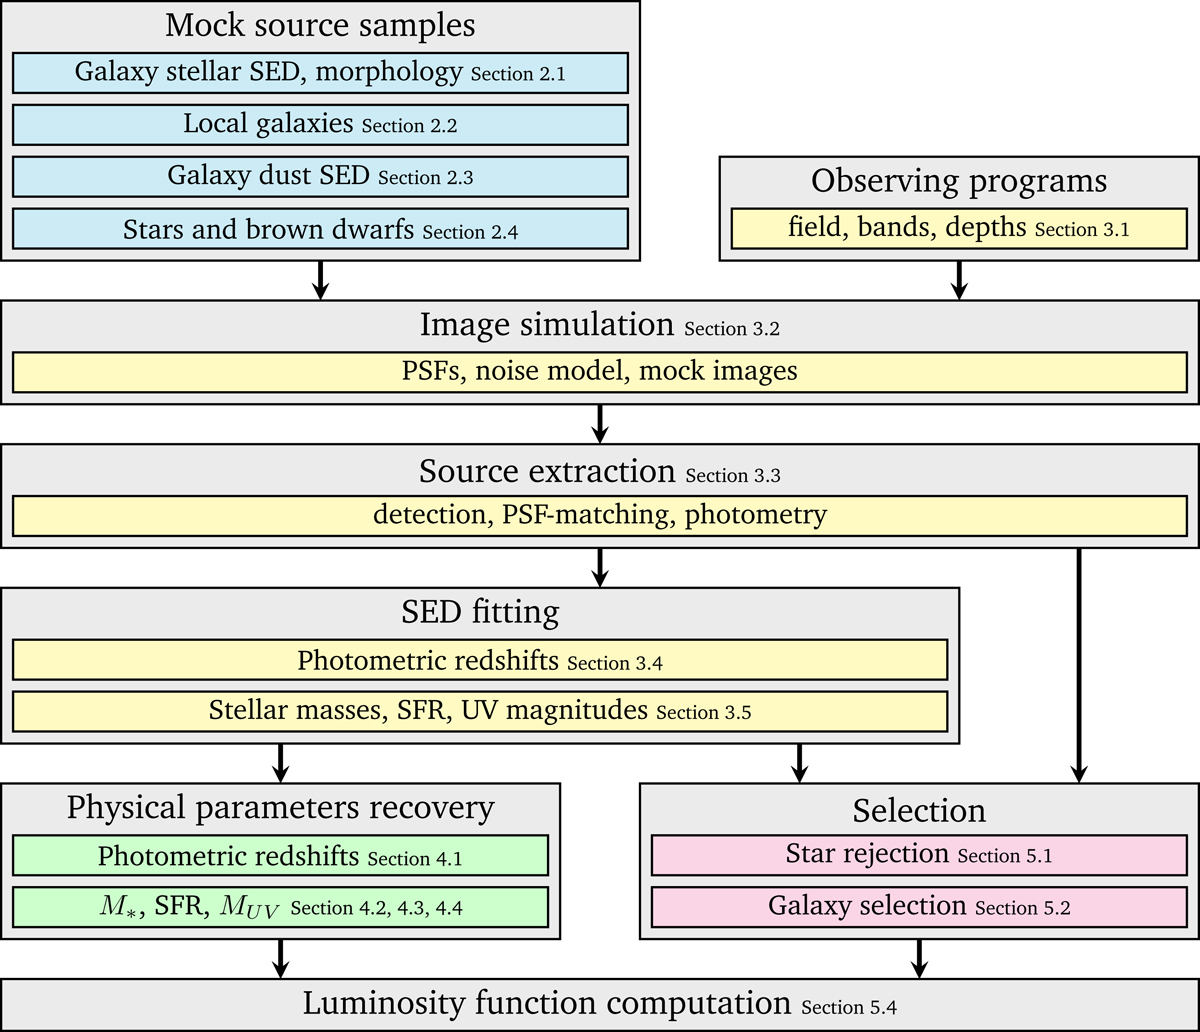
Diagram summarizing the procedures to make our predictions. The gray boxes indicate the essential steps, and colored boxes show the detail of the subsections. The colors code for the main sections.
Current usage metrics show cumulative count of Article Views (full-text article views including HTML views, PDF and ePub downloads, according to the available data) and Abstracts Views on Vision4Press platform.
Data correspond to usage on the plateform after 2015. The current usage metrics is available 48-96 hours after online publication and is updated daily on week days.
Initial download of the metrics may take a while.