Fig. 8.
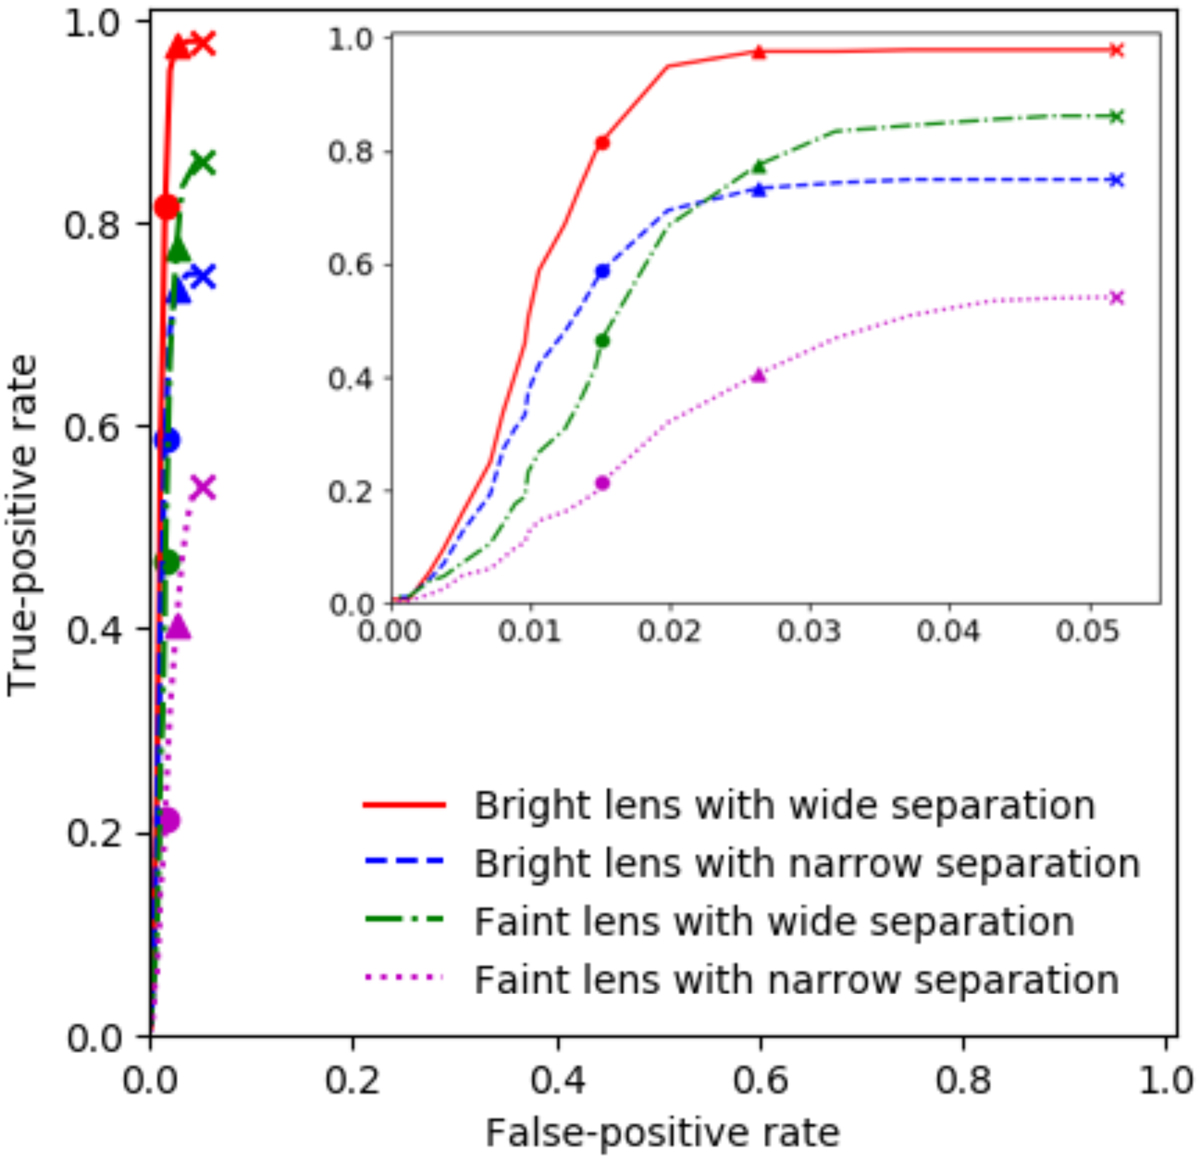
ROC curves of the lens search method using both spatial extent and number of blobs. The subgroups of lensed quasars are the same as the subgroups in Fig. 6. The ROC curves are plotted by varying pthrs% from 0% to 99.5% at Nthrs = 4 with the preselection on the number of blobs Ncrit = 2. The crosses, triangles, and circles indicate the points on the ROC curves when pthrs% = 0%,55%, and 75%, respectively. With the preselection Ncrit = 2, our lens search algorithm could identify the bright lensed quasars with wide separation at (TPR, FPR) = (97.6%,2.6%), which is similar to the lens search performance when no preselection is performed. The ROC curves also start from a much lower FPR (crosses) with the preselection Ncrit = 2. The ROC curves are zoomed-in with the FPR (x-axis) spanning from 0 to 0.05 in the small panel.
Current usage metrics show cumulative count of Article Views (full-text article views including HTML views, PDF and ePub downloads, according to the available data) and Abstracts Views on Vision4Press platform.
Data correspond to usage on the plateform after 2015. The current usage metrics is available 48-96 hours after online publication and is updated daily on week days.
Initial download of the metrics may take a while.