Fig. 4.
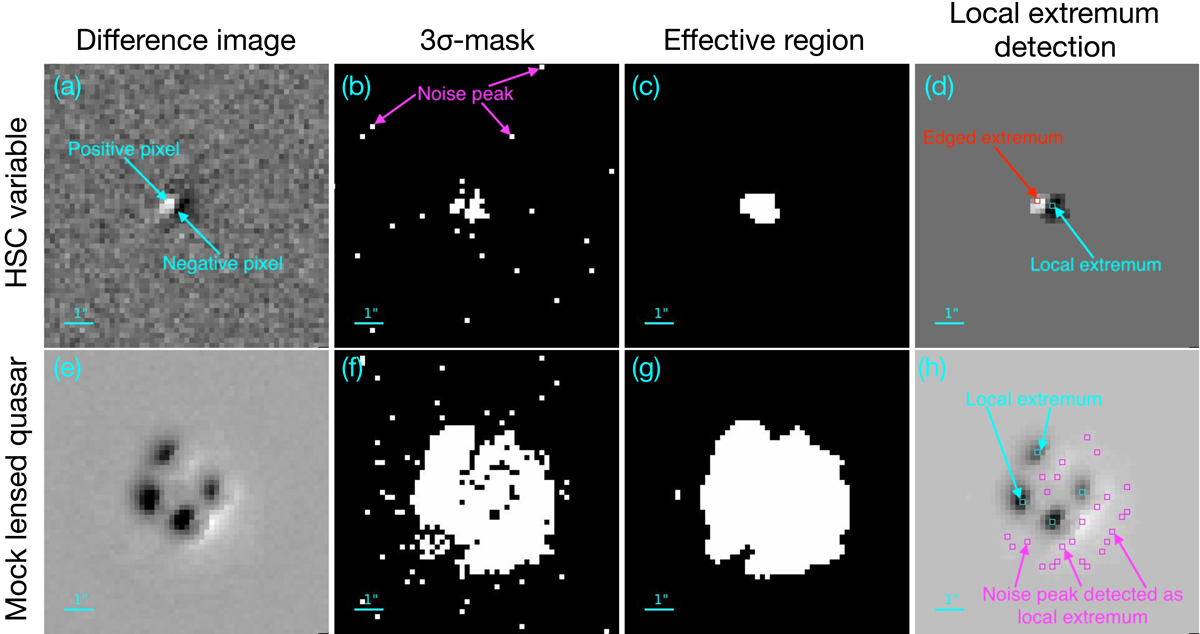
Examples of a HSC variable (top row) and an injected lensed quasar (bottom row). From left to right: difference image, the corresponding 3σ mask, the corresponding effective region, and the corresponding local extremum detection. In 3σ masks, the white pixels represent the pixels with values larger than 3σ or smaller than −3σ in the difference images. The effective regions denoted by the white pixels show the spatial extent of the objects, after removing noise peaks in the 3σ masks. In the local extremum detection, pixels with values larger than all the neighboring pixels or smaller than all the neighboring pixels in the difference images within the effective regions are selected; the local extrema, indicated in cyan, correspond to the “blobs” (see Sect. 4.2 for details) of the HSC variable/mock lensed quasar, the local extrema indicated in magenta are the noise peaks, and the pixel indicated as “edged extremum” in red is a blob that should be picked as a local extremum, but is missed because it is located at the edge of the effective region. The size of each image cutout is 10″ × 10″.
Current usage metrics show cumulative count of Article Views (full-text article views including HTML views, PDF and ePub downloads, according to the available data) and Abstracts Views on Vision4Press platform.
Data correspond to usage on the plateform after 2015. The current usage metrics is available 48-96 hours after online publication and is updated daily on week days.
Initial download of the metrics may take a while.