Open Access
Fig. 3.
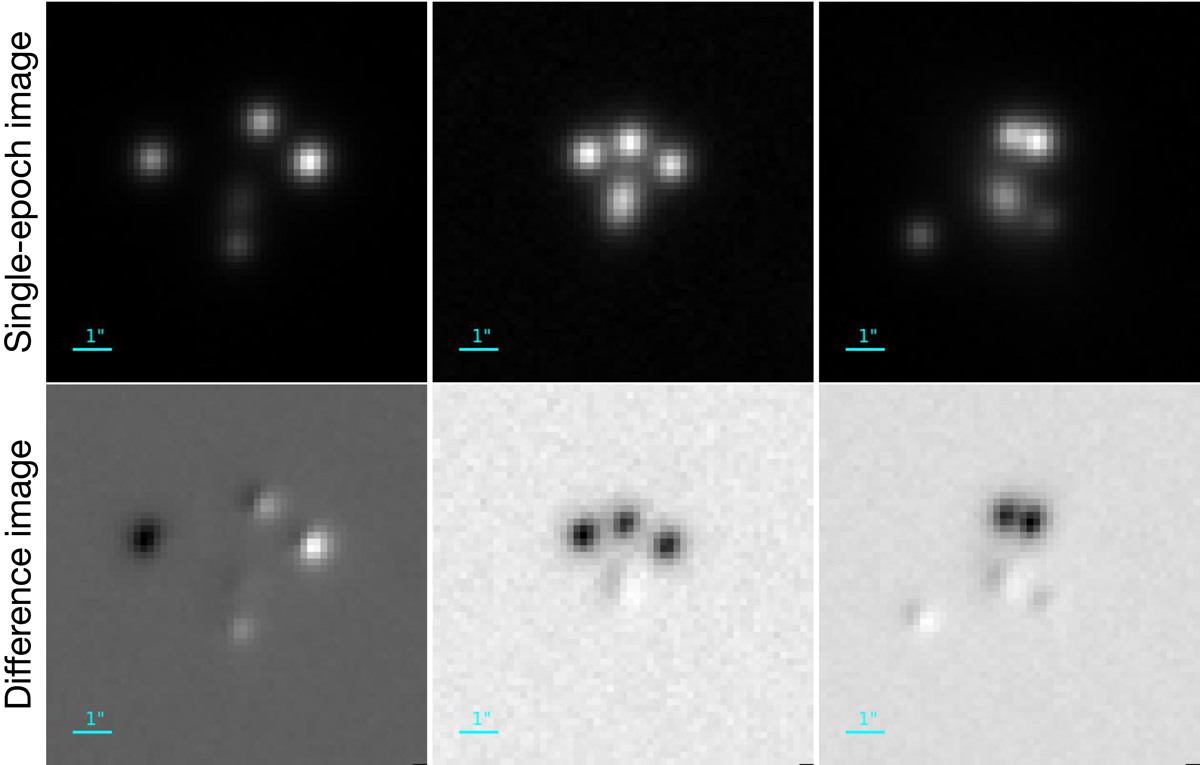
Examples of lenses injected into the HSC transient survey. Top: single-epoch images co-added by the pipeline of the HSC transient survey. Bottom: corresponding difference images of the top row produced by the image subtraction in the pipeline of the HSC transient survey. The size of each image cutout is 10″ × 10″.
Current usage metrics show cumulative count of Article Views (full-text article views including HTML views, PDF and ePub downloads, according to the available data) and Abstracts Views on Vision4Press platform.
Data correspond to usage on the plateform after 2015. The current usage metrics is available 48-96 hours after online publication and is updated daily on week days.
Initial download of the metrics may take a while.