Fig. 2.
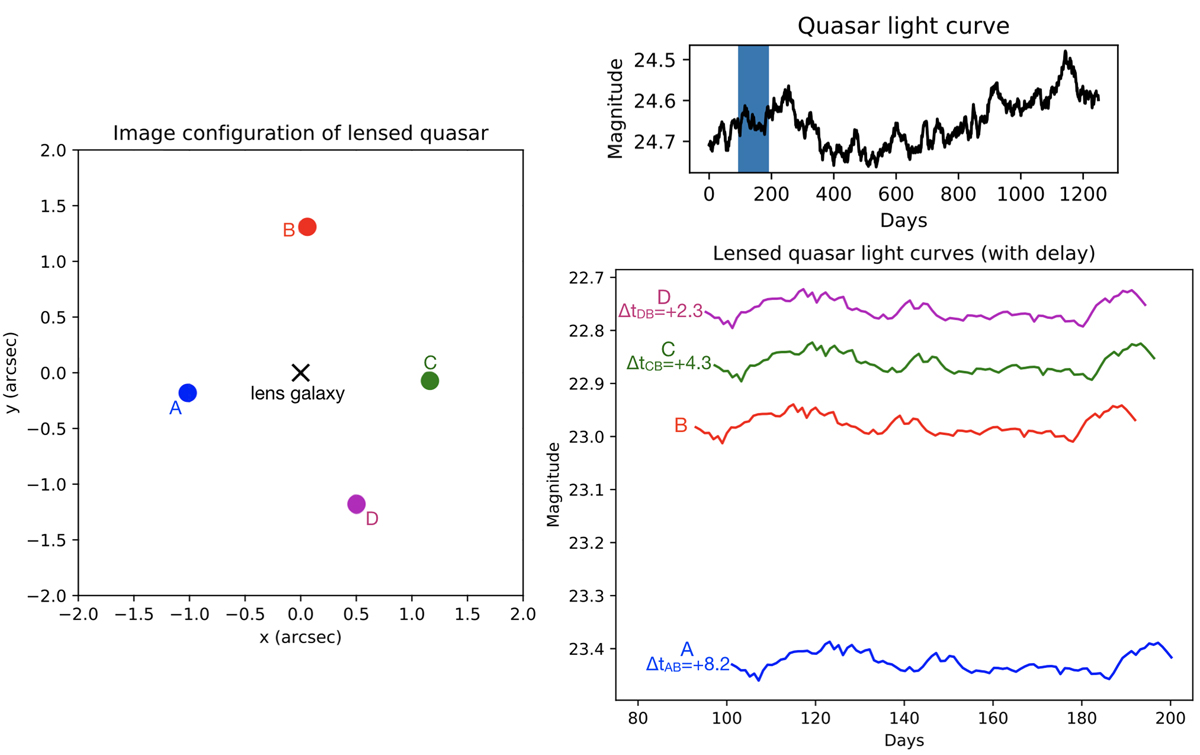
Illustration of generating light curves for a lensed quasar without its (lensed) host galaxy. Left: positions of the four multiple images (A, B, C, and D) and the lens galaxy (cross). Top right: mock quasar light curve. Bottom right: the lensed light curves of the four multiple images in the left panel, for the period marked by the blue band in the top right panel.
Current usage metrics show cumulative count of Article Views (full-text article views including HTML views, PDF and ePub downloads, according to the available data) and Abstracts Views on Vision4Press platform.
Data correspond to usage on the plateform after 2015. The current usage metrics is available 48-96 hours after online publication and is updated daily on week days.
Initial download of the metrics may take a while.