Fig. A.1.
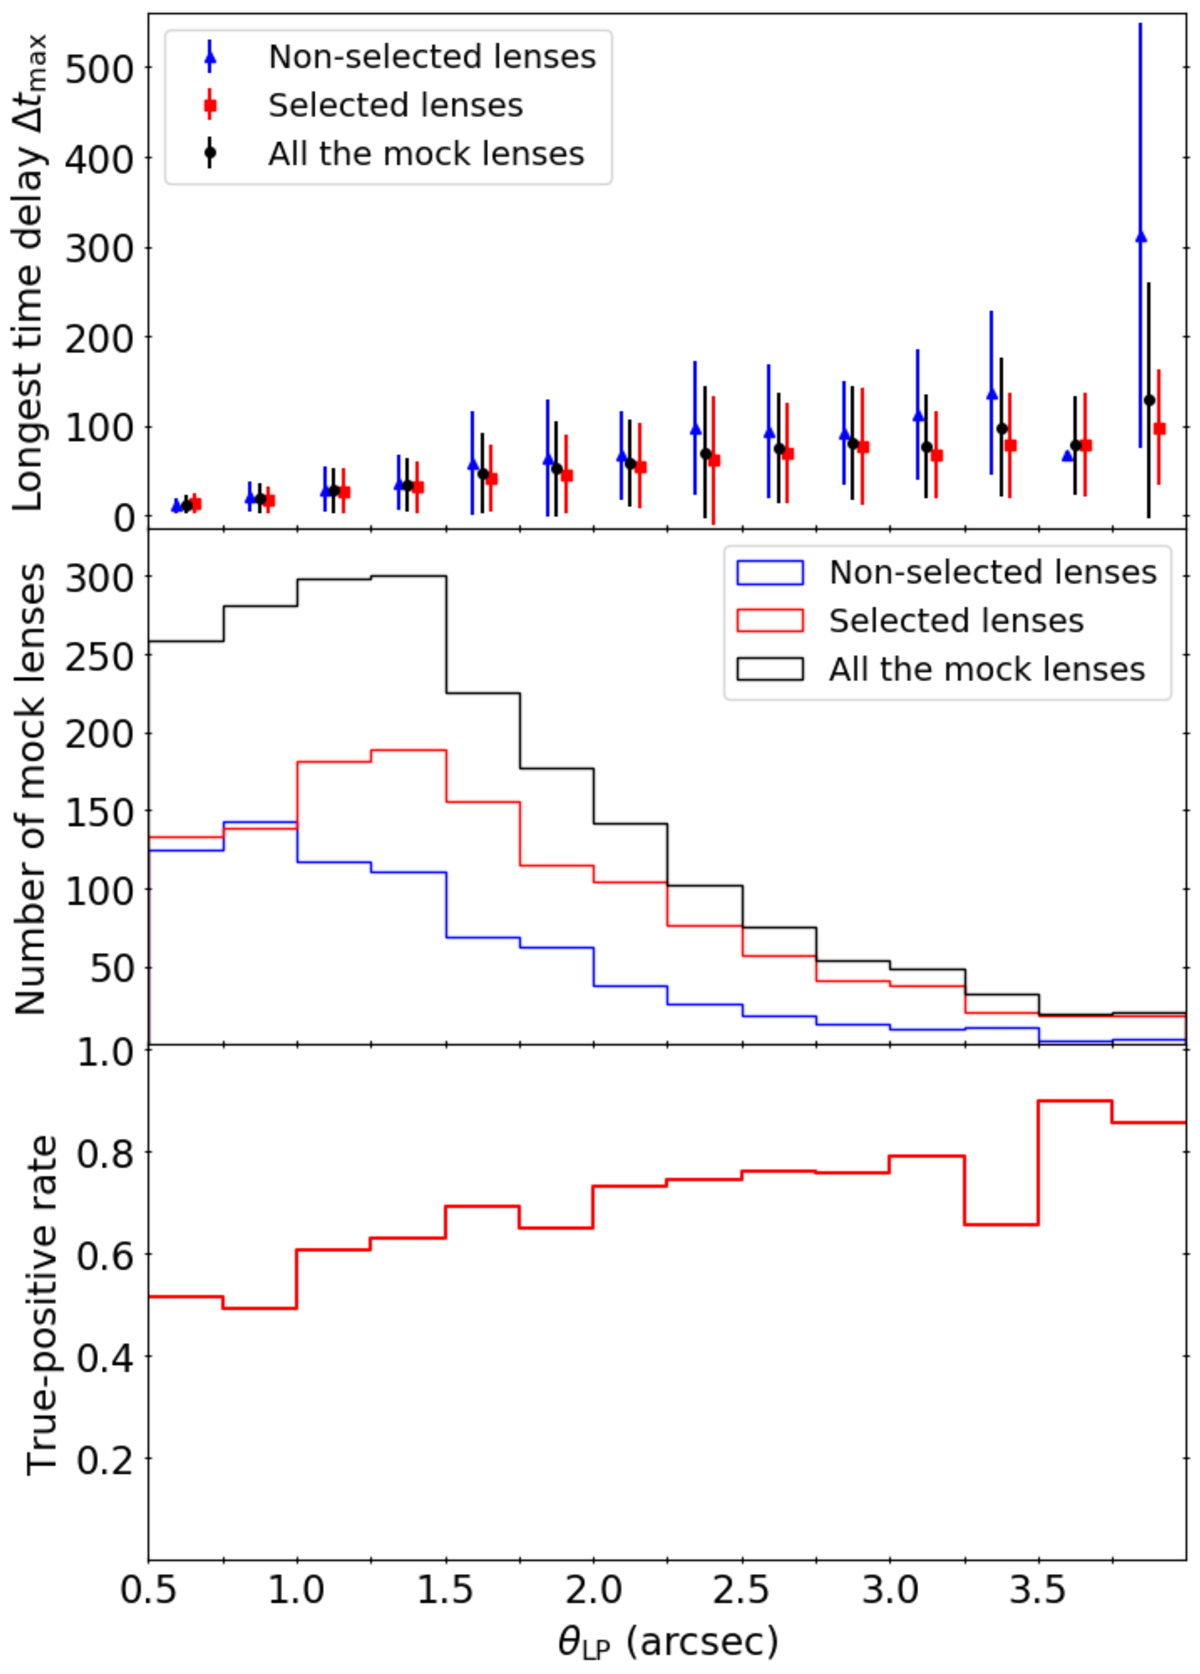
Distribution of the longest time delay Δtmax for the non-selected lensed quasars and the selected lensed quasars. Top panel: mean values of Δtmax with 1 standard deviation as the error bars from the lensed quasars in each θLP bin. Middle panel: number of non-selected lensed quasars, the number of selected lensed quasars, and the number of total mock lenses in each θLP bin. Bottom panel: TPR in each θLP bin. The sensitivity of the lens search algorithm mainly comes from the separation (θLP), not the time delay (Δtmax).
Current usage metrics show cumulative count of Article Views (full-text article views including HTML views, PDF and ePub downloads, according to the available data) and Abstracts Views on Vision4Press platform.
Data correspond to usage on the plateform after 2015. The current usage metrics is available 48-96 hours after online publication and is updated daily on week days.
Initial download of the metrics may take a while.