Fig. 12.
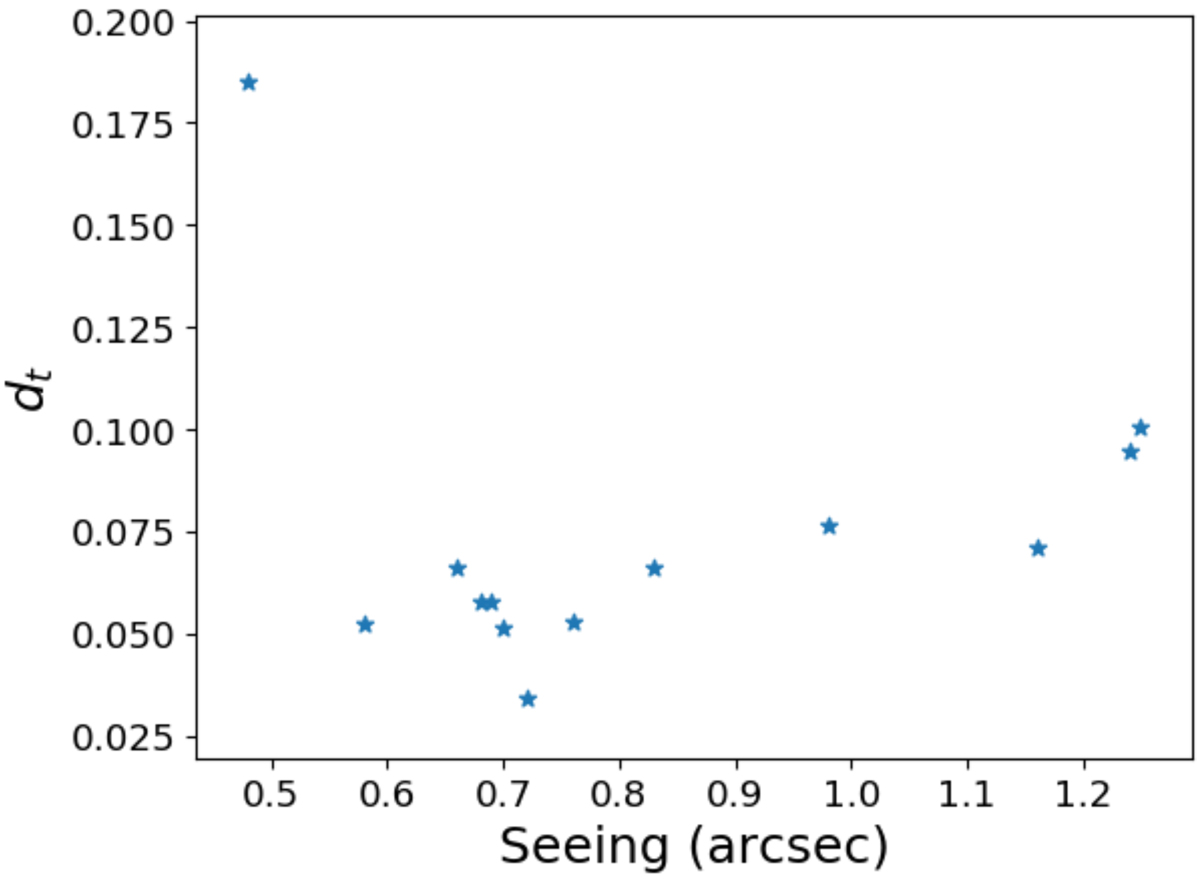
Relation between the lens search performance and the seeing in each single epoch from the HSC transient survey. The quantity dt is defined as the minimum distance between (TPR, FPR) = (100%,0%) and the ROC curve of the bright lensed quasars (m3rd < 22.0 mag) with wide separation (θLP > 1.5″) for each epoch t. The 13 star symbols indicate the dt values for the 13 epochs, plotted against their corresponding seeing. Our lens search algorithm performs well when the single epoch has seeing ∼0.7″. The low lens search performance in the epoch with extraordinary seeing (< 0.5″) is due to the significant artifacts in the difference image from the sharp image.
Current usage metrics show cumulative count of Article Views (full-text article views including HTML views, PDF and ePub downloads, according to the available data) and Abstracts Views on Vision4Press platform.
Data correspond to usage on the plateform after 2015. The current usage metrics is available 48-96 hours after online publication and is updated daily on week days.
Initial download of the metrics may take a while.