Fig. 11.
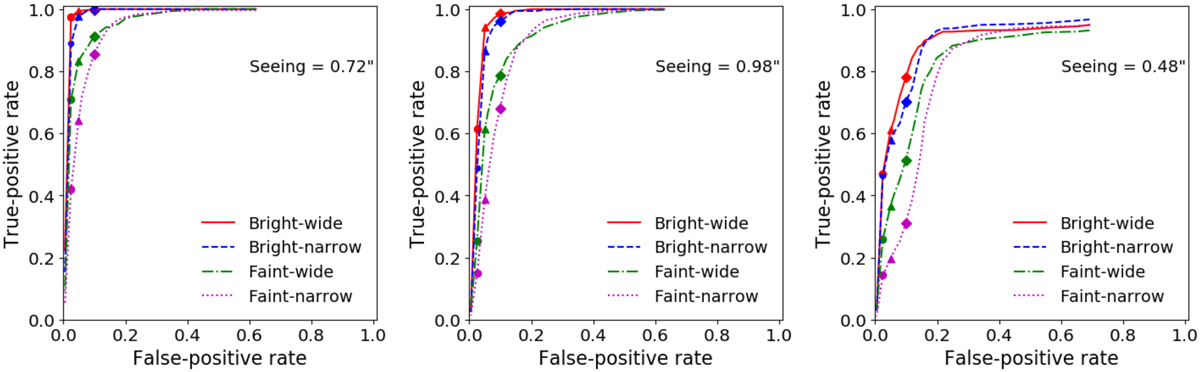
Lens search performance based on a single epoch. The lens search algorithm is tested using difference images from only one single epoch for all the 13 epochs in the HSC transient survey; the ROC curves of the epochs with the best performance (left), the average performance (middle), and the worst performance (right) are shown. For lens search algorithm based on a single epoch, only pthrs is used as constraint. In each panel, the ROC curves are plotted by varying pthrs%; the diamonds, triangles, and circles indicate the points on the ROC curves at pthrs% = 90%,95%, and 97.5%. The seeing of each epoch is also indicated in each panel. The best lens search performance happened in the single epoch with a seeing of 0.72″, capturing the bright lensed quasars with wide separation at (TPR, FPR) = (97.6%,2.4%) when pthrs% = 97.5%. In a single epoch with average seeing (∼0.98″), the lens search algorithm can detect the bright lensed quasars with wide separation at (TPR, FPR) = (94.2%,5.0%) when pthrs% = 95.0%. The worst lens search performance happens in the epoch with an exceptional seeing value of 0.48″ due to artifacts appearing in the difference image pipeline when the seeing is “too” good.
Current usage metrics show cumulative count of Article Views (full-text article views including HTML views, PDF and ePub downloads, according to the available data) and Abstracts Views on Vision4Press platform.
Data correspond to usage on the plateform after 2015. The current usage metrics is available 48-96 hours after online publication and is updated daily on week days.
Initial download of the metrics may take a while.