Fig. 9.
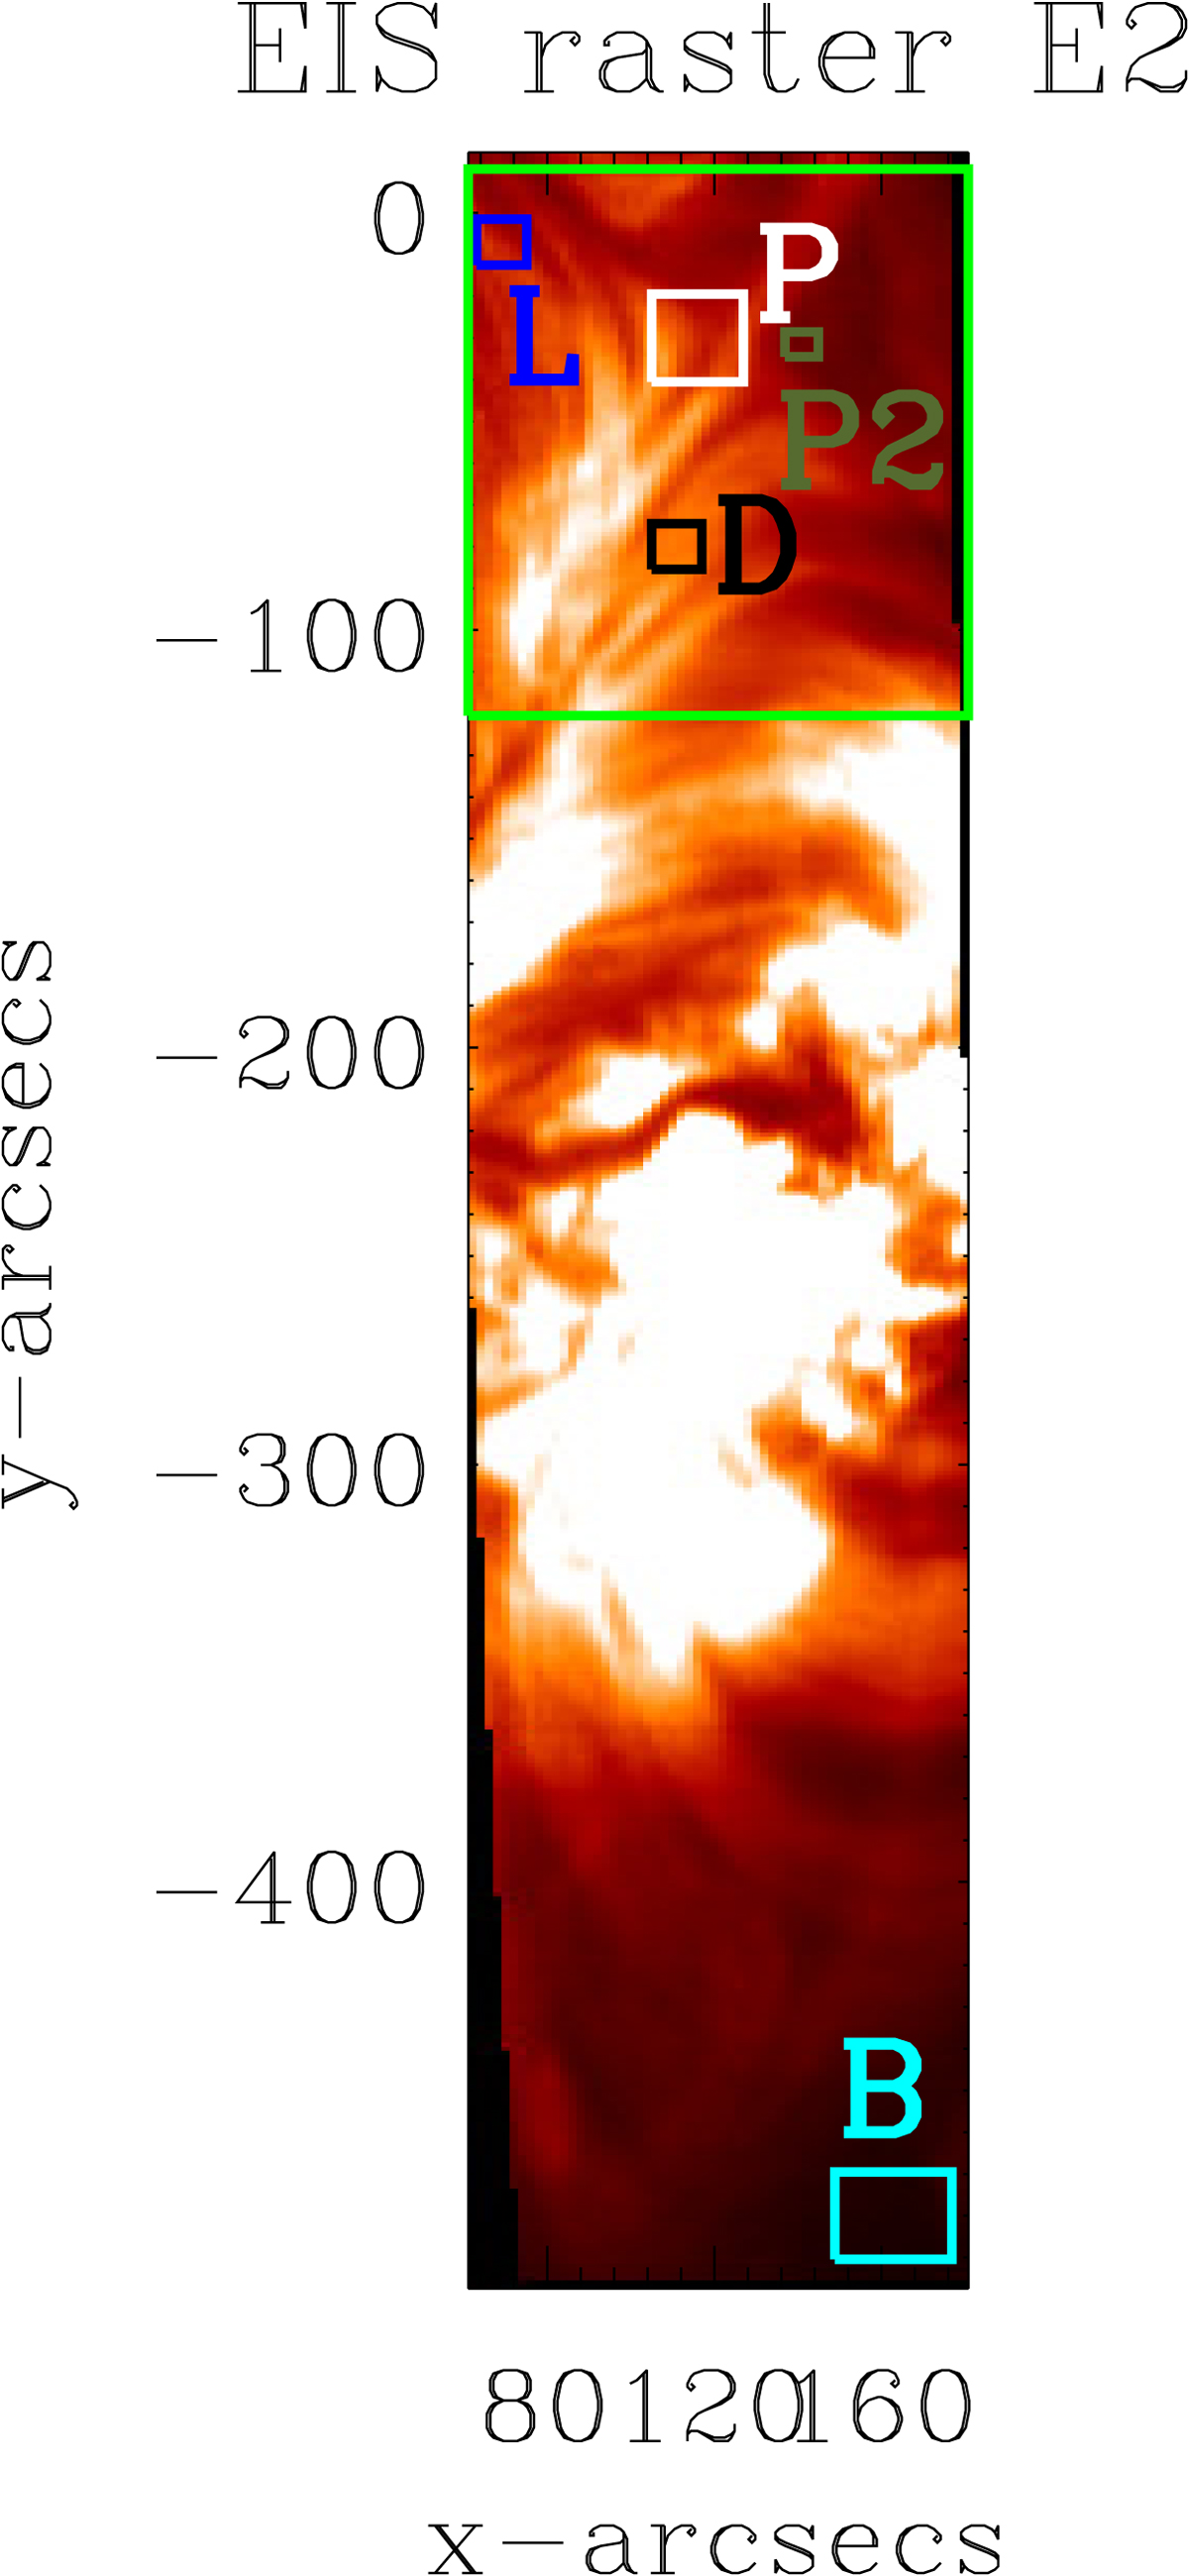
Identification of different regions in the FOV for the TELs (“L”, in blue), X-shaped region (“P”, in white) and the hot loops beneath (“D”, in black) on the background intensity map of Fe XII 195 Å at E2. “P2” (in olive) is the region which undergoes several brightenings at regular intervals within the EIS observation period E2 and has four EIS exposures, coinciding exactly with the position of the brightening. The box identified with “B” marks the region considered for background/foreground assessment. The large green box indicates the ROI of the study.
Current usage metrics show cumulative count of Article Views (full-text article views including HTML views, PDF and ePub downloads, according to the available data) and Abstracts Views on Vision4Press platform.
Data correspond to usage on the plateform after 2015. The current usage metrics is available 48-96 hours after online publication and is updated daily on week days.
Initial download of the metrics may take a while.