Fig. 8.
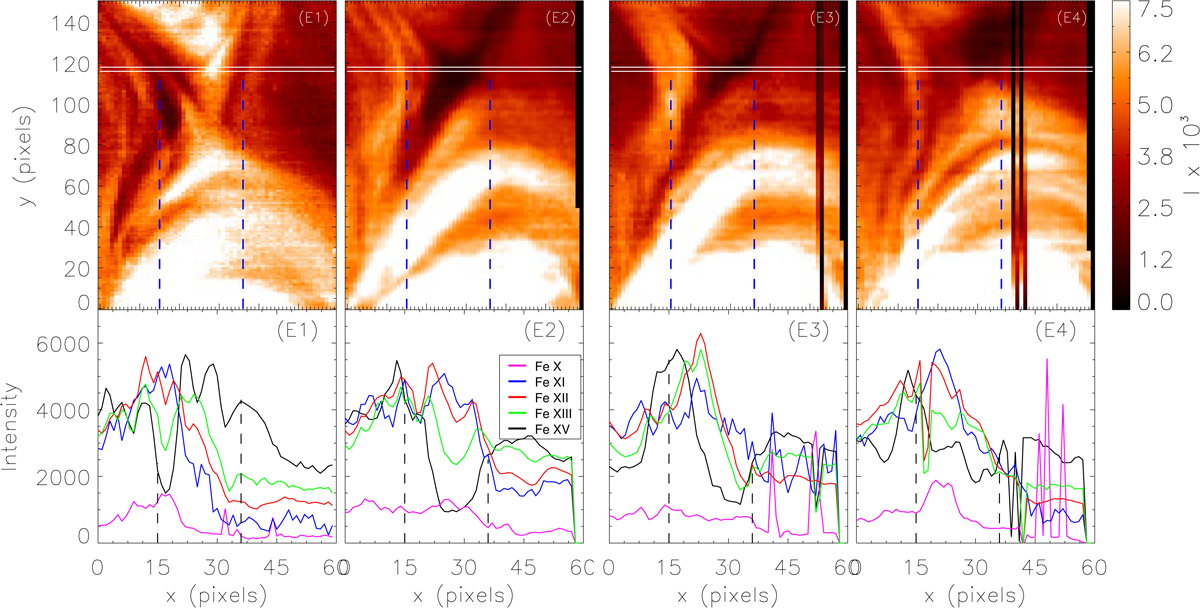
Top panels: EIS intensity maps obtained in Fe XV. The horizontal white stripe is the region for which the averaged light curve is obtained. Bottom panels: average light curves within the white stripes in spectral lines as labelled. The vertical black dashed lines in the bottom panel(s) correspond to the same pixel position as indicated by the vertical blue dashed lines in the top panel(s), highlighting the intensity variation in the X-region.
Current usage metrics show cumulative count of Article Views (full-text article views including HTML views, PDF and ePub downloads, according to the available data) and Abstracts Views on Vision4Press platform.
Data correspond to usage on the plateform after 2015. The current usage metrics is available 48-96 hours after online publication and is updated daily on week days.
Initial download of the metrics may take a while.