Fig. 5.
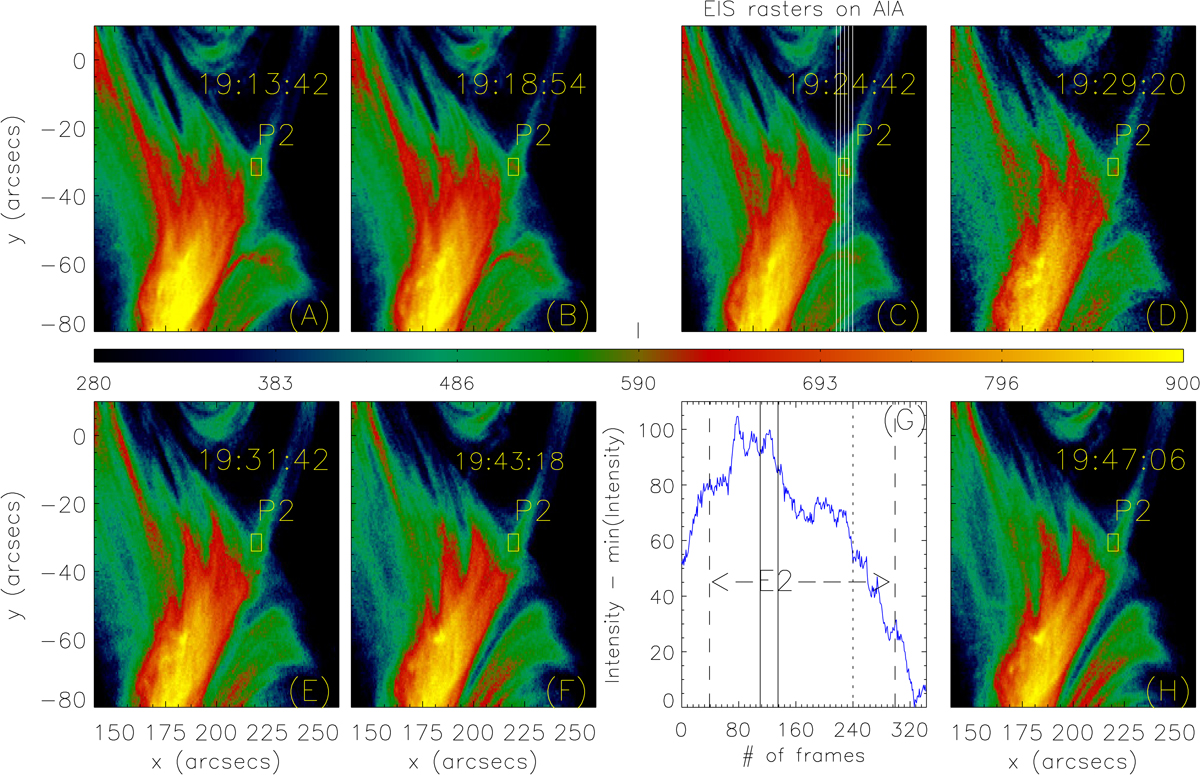
Panels A–F and H: AIA 193 Å intensity images at different instants, roughly coinciding with the EIS observation period for E2. “P2” (highlighted by the yellow box) denotes the location for recurrent brightenings. The white vertical lines in panel C show that four EIS exposures which cover the location of this brightening. Panel G: corresponding light curve in “P2”, between 18:55:07 and 20:14:55 UT at a cadence of 12 s. The exact duration of E2 is marked by the dashed vertical black lines. The black bold lines indicate the increase in intensity in “P2” corresponding to the EIS exposures shown with white lines in panel C.
Current usage metrics show cumulative count of Article Views (full-text article views including HTML views, PDF and ePub downloads, according to the available data) and Abstracts Views on Vision4Press platform.
Data correspond to usage on the plateform after 2015. The current usage metrics is available 48-96 hours after online publication and is updated daily on week days.
Initial download of the metrics may take a while.