Fig. 4.
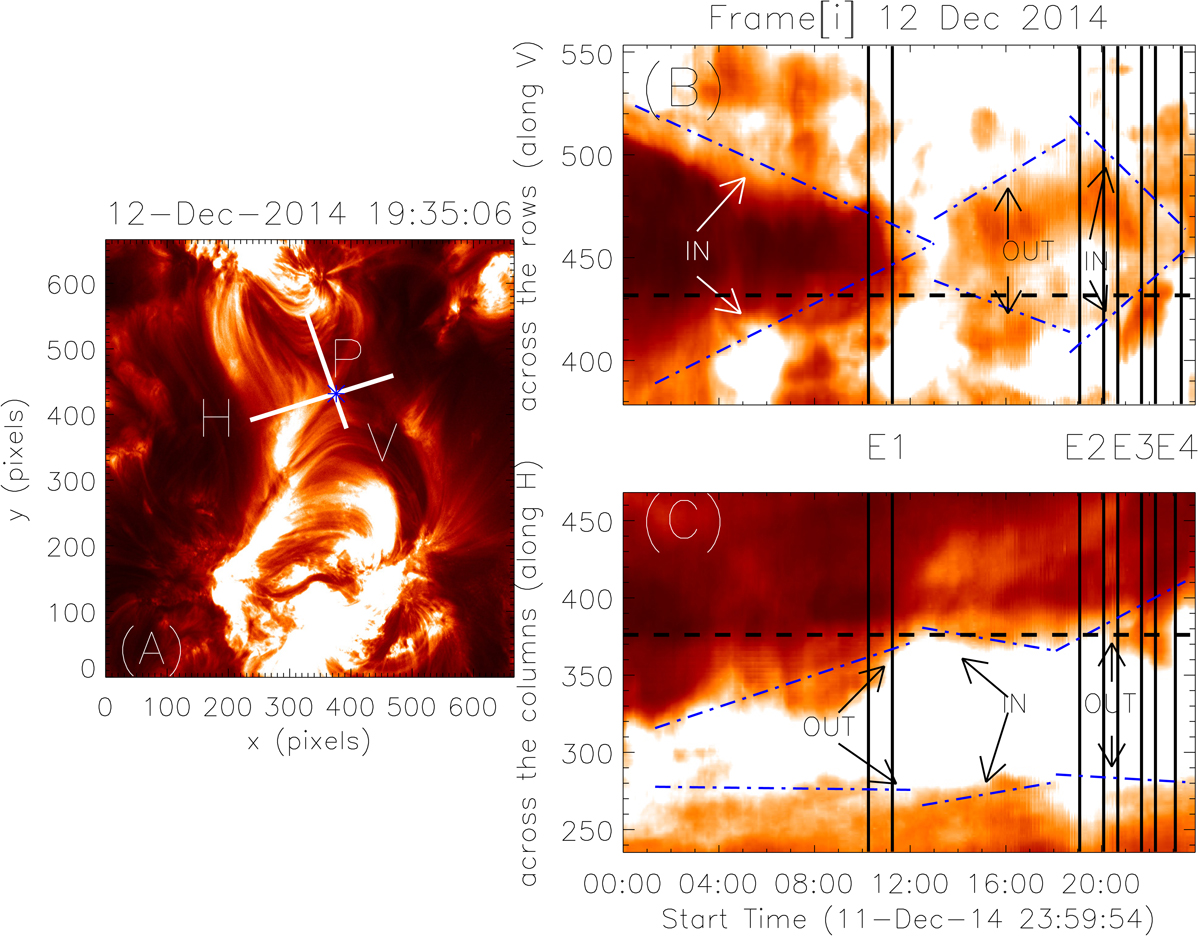
Panel A: TELs seen in AIA 193 Å channel in pixel coordinates at a given instant belonging to EIS raster E2. The white lines are the slits, marked as “H” and “V” and the point “P” (“*”, in blue) denotes the intersection. Panels B and C: intensity fluctuations along the slits “V” and “H” respectively in the xt plots. The over-plotted solid black lines indicate the EIS raster durations, with numbers “E1”, “E2”, “E3”, and “E4” indicating the respective raster number. The dashed-dotted blue lines track the displacement of plasma with time. The black dashed line shows the position of the point “P” in pixel coordinates.
Current usage metrics show cumulative count of Article Views (full-text article views including HTML views, PDF and ePub downloads, according to the available data) and Abstracts Views on Vision4Press platform.
Data correspond to usage on the plateform after 2015. The current usage metrics is available 48-96 hours after online publication and is updated daily on week days.
Initial download of the metrics may take a while.