Fig. 2.
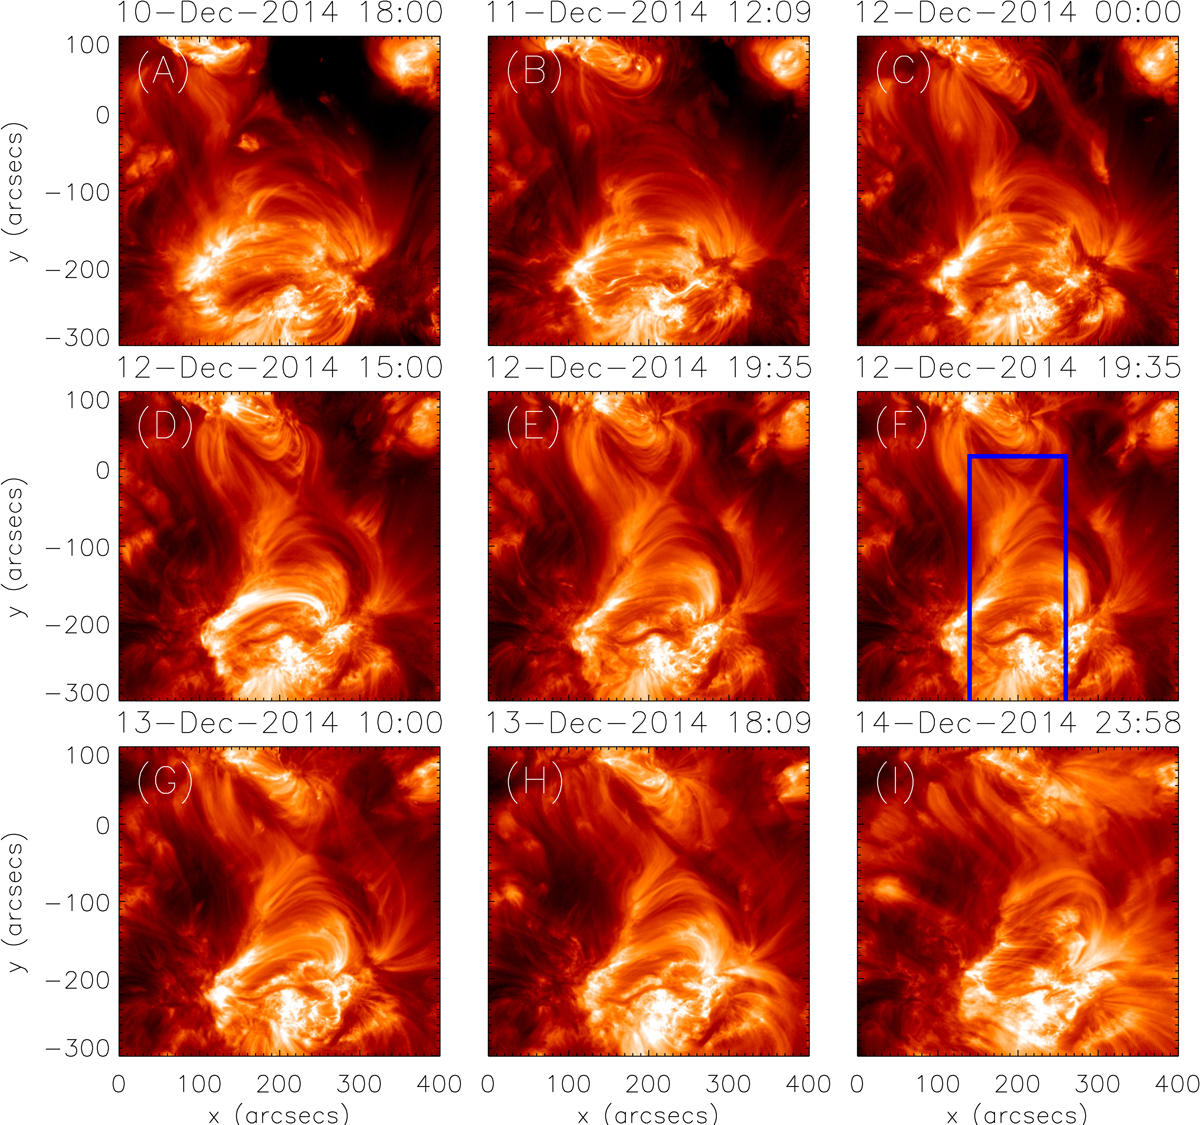
Formation and evolution of the region showing TELs (corresponding to the FOV shown in panel B of Fig. 1) as observed in AIA 193 Å images for five days between 10 and 14 December 2014. The over-plotted blue box in panel F shows the EIS raster FOV. All the AIA data shown here are differentially rotated to the center time of raster E2.
Current usage metrics show cumulative count of Article Views (full-text article views including HTML views, PDF and ePub downloads, according to the available data) and Abstracts Views on Vision4Press platform.
Data correspond to usage on the plateform after 2015. The current usage metrics is available 48-96 hours after online publication and is updated daily on week days.
Initial download of the metrics may take a while.