Fig. 10.
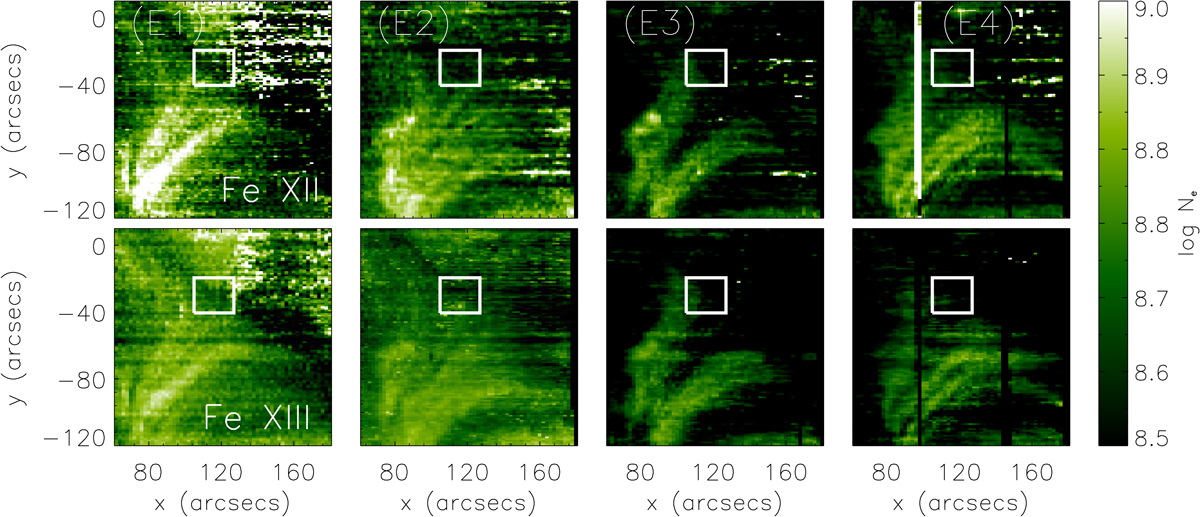
Density maps using EIS lines Fe XII (log T[K] = 6.20) and Fe XIII (log T[K] = 6.25). The raster number on the top panel of each column is true for all the spectral lines whereas the each row corresponds to the same spectral line as mentioned in the leftmost panel of each row. The white box in each panel shows the X-region. Background/foreground emission has been accounted for.
Current usage metrics show cumulative count of Article Views (full-text article views including HTML views, PDF and ePub downloads, according to the available data) and Abstracts Views on Vision4Press platform.
Data correspond to usage on the plateform after 2015. The current usage metrics is available 48-96 hours after online publication and is updated daily on week days.
Initial download of the metrics may take a while.