Fig. 1.
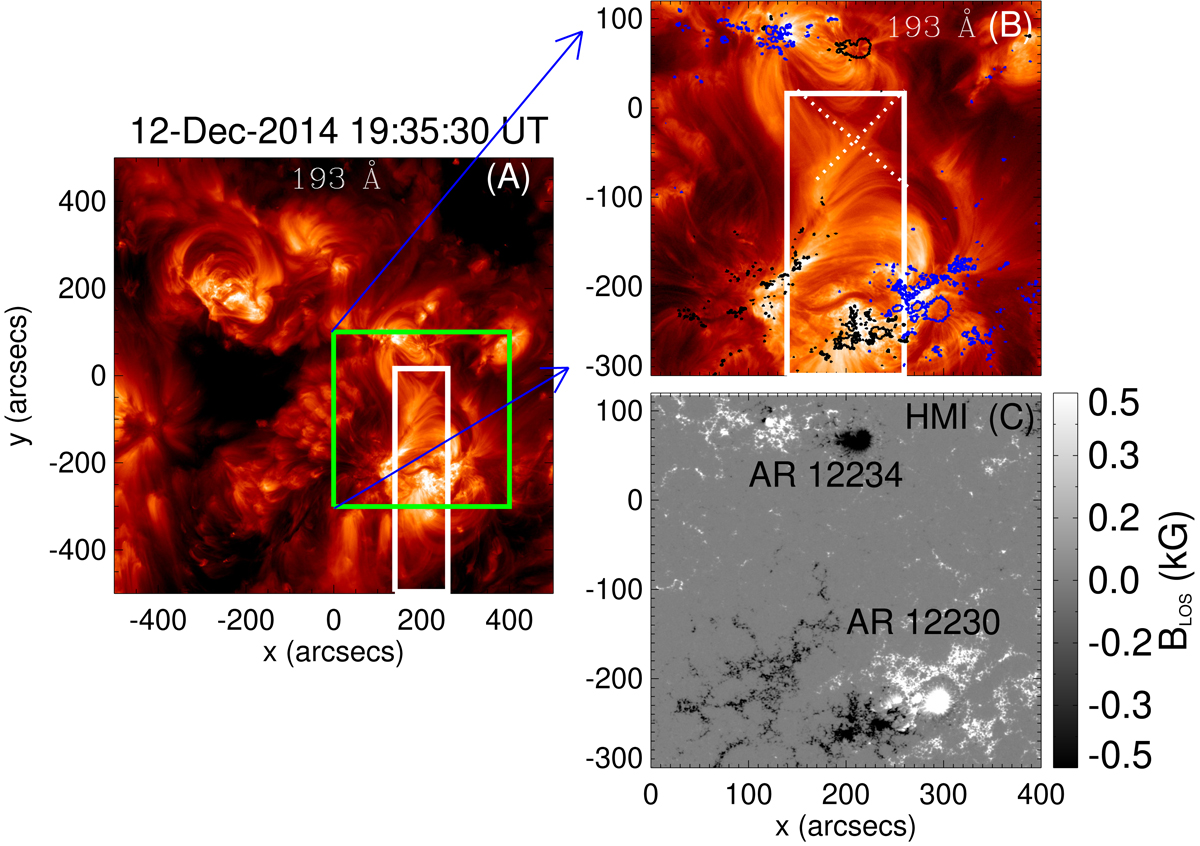
Panel A: AIA 193 Å images showing the portion of the solar disk that contains the two active regions between which the transequatorial loops are formed. The over-plotted green box shows the FOV of AIA that is considered for further analysis. The white box is the FOV that was rastered using EIS. Panel B: zoom-in view of AIA 193 Å images corresponding to the green box in the left panel showing the X-type topology formed between the TELs (white dotted line). The white box shows the EIS raster FOV. The white dotted lines are drawn to guide the eye on the X-shaped structure. The blue and black contours represent positive and negative polarity regions, respectively with magnetic flux density of ±500 G as observed by HMI at 19:35:40 UT. Panel C: HMI LOS magnetogram image at the same instant as shown in the contours of panel B. The two active regions AR 12230 and AR 12234 are marked here.
Current usage metrics show cumulative count of Article Views (full-text article views including HTML views, PDF and ePub downloads, according to the available data) and Abstracts Views on Vision4Press platform.
Data correspond to usage on the plateform after 2015. The current usage metrics is available 48-96 hours after online publication and is updated daily on week days.
Initial download of the metrics may take a while.