Fig. 4
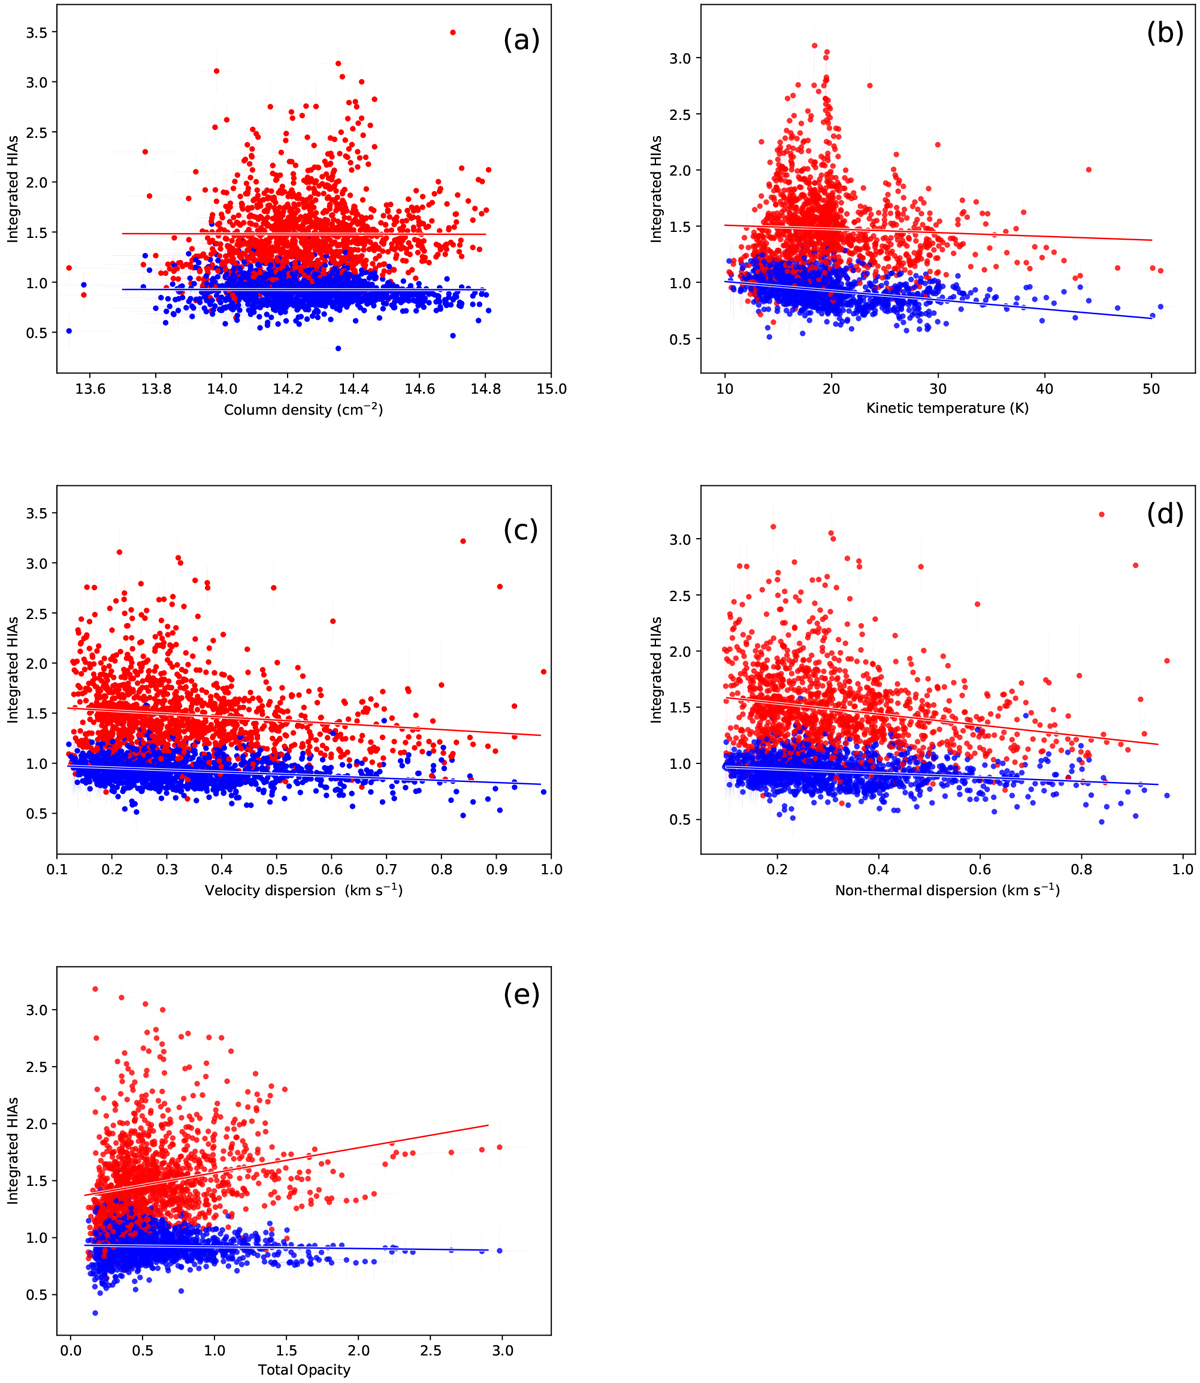
Comparisons of the integrated hyperfine intensity anomalies (inner satellites: blue dots; outer satellites: red dots) with the para-NH3 column density (a), kinetic temperature (b), velocity dispersion (c), non-thermal velocity dispersion (d), and total optical depth of NH3 (1,1) (e) all derived from the GBT NH3 observations(Friesen et al. 2017).
Current usage metrics show cumulative count of Article Views (full-text article views including HTML views, PDF and ePub downloads, according to the available data) and Abstracts Views on Vision4Press platform.
Data correspond to usage on the plateform after 2015. The current usage metrics is available 48-96 hours after online publication and is updated daily on week days.
Initial download of the metrics may take a while.